

Cancer specific promoter CpG Islands hypermethylation of HOP homeobox (HOPX) gene and its potential tumor suppressive role in pancreatic carcinogenesis
- PMID: 22958219
- PMCID: PMC3488580
- DOI: 10.1186/1471-2407-12-397
Cancer specific promoter CpG Islands hypermethylation of HOP homeobox (HOPX) gene and its potential tumor suppressive role in pancreatic carcinogenesis
Abstract
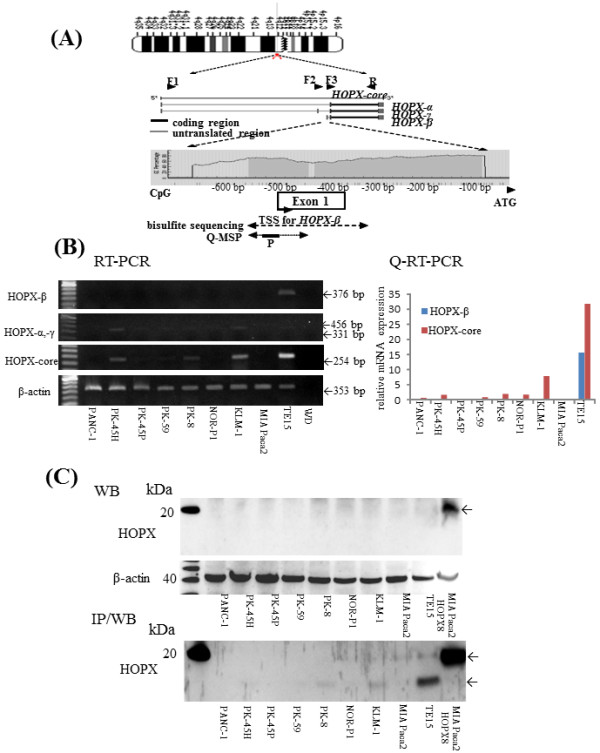
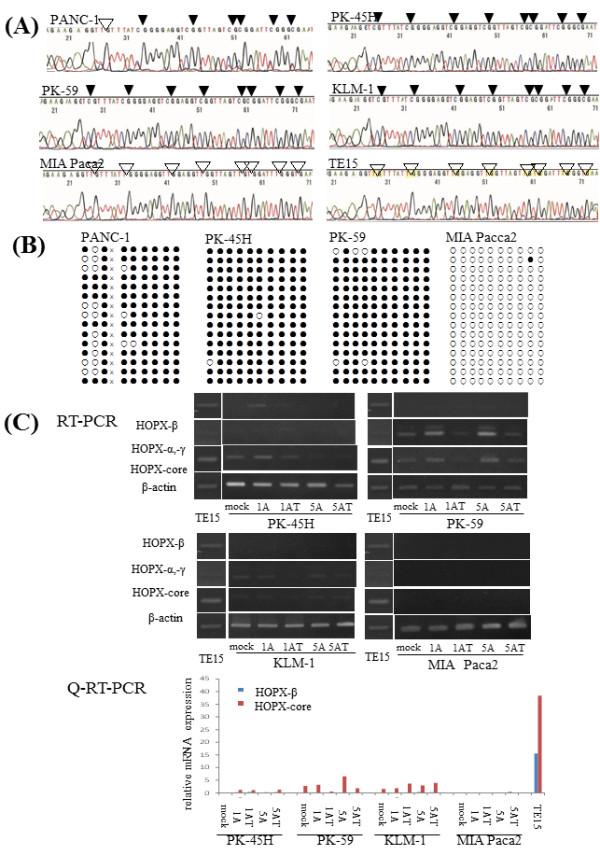
Background: We have recently identified HOP hoemobox (HOPX) as a tumor suppressor gene candidate, characterized by tumor-specific promoter DNA hypermethylation in human cancers, and it can remarkably inhibit tumors' aggressive phenotypes. In this current study, we for the first time examined methylation level of HOPX and tested the functional relevance in pancreatic cancer (PC).
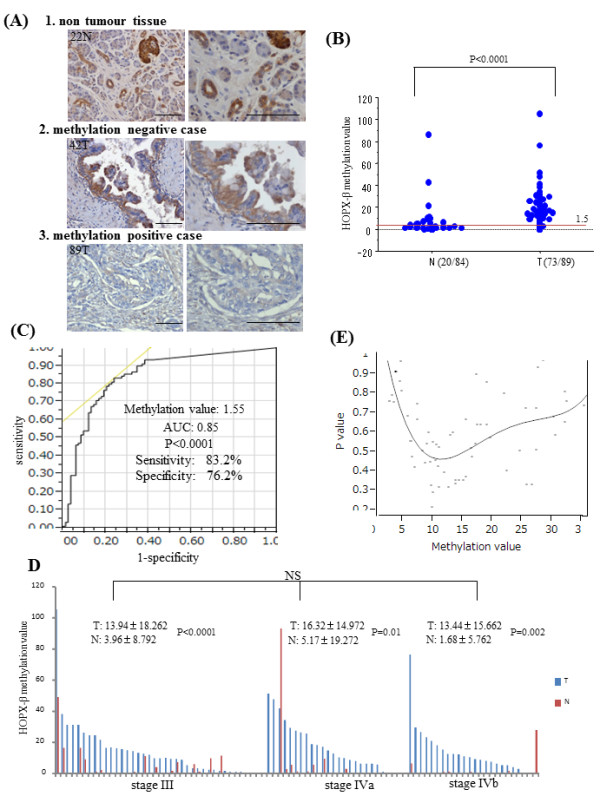
Methods: Clinical features of HOPX promoter hypermethylation was investigated in 89 PC tissues, and immunohistochemistry was added. We also examined its functional relevance in phenotype assays such as soft agar, proliferation, invasion, and cell cycle analysis.
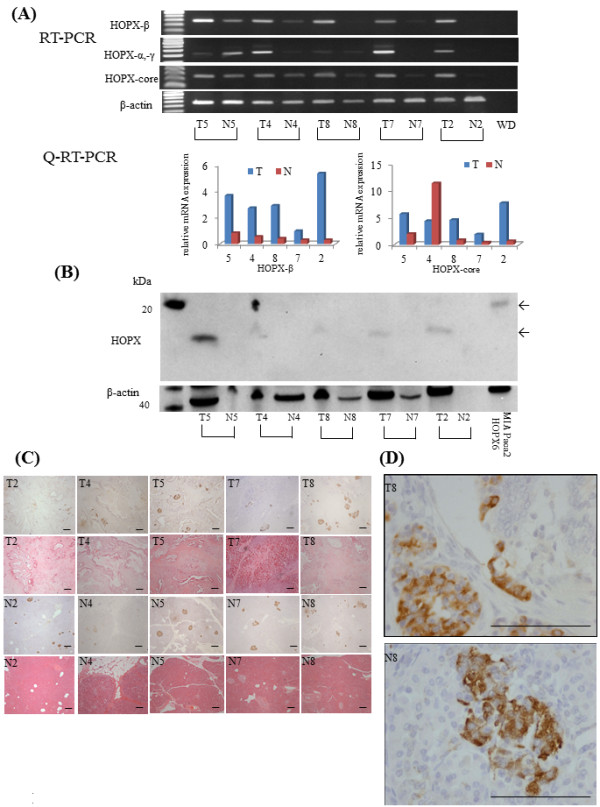
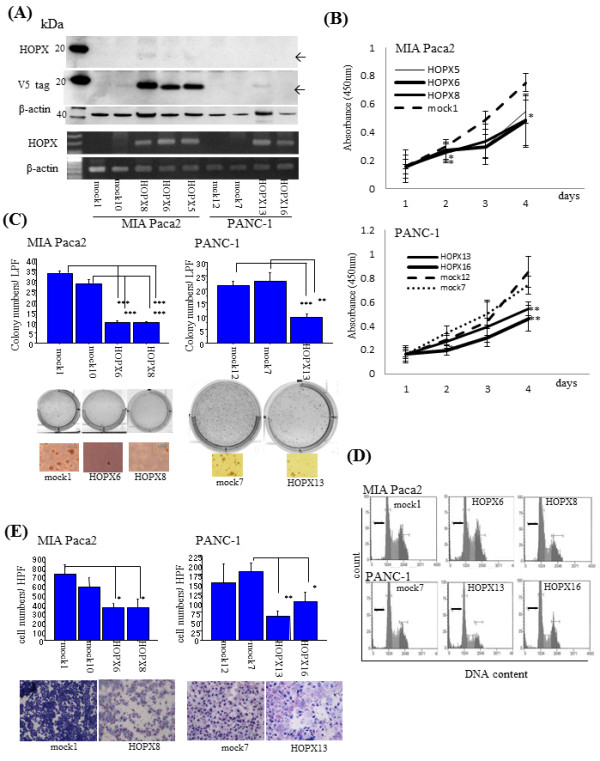
Results: PC tissues had HOPX gene hypermethylation as compared to the corresponding normal pancreas tissues, and its uniqueness was robust to discriminate tumor from normal tissues (AUC = 0.85, P < 0.0001). Unexpectedly, HOPX was increased in expression in tumor tissues, and immunohistochemistry revealed its predominant expression in the Langerhans islet cells, where HOPX was reduced in expression for PC cells with promoter hypermethylation. HOPX transfectants exhibited G1 arrest with subG1 accumulation, and inhibited tumor forming and invasive ability.
Conclusion: Defective expression of HOPX which is consistent with promoter DNA hypermethylation may explain aggressive phenotype of pancreatic cancer, and intense expression of HOPX in the Langerhans cells may in turn uniquely contribute to pancreatic carcinogenesis.
Figures
Similar articles
-
Potential utility of HOP homeobox gene promoter methylation as a marker of tumor aggressiveness in gastric cancer.Oncogene. 2010 Jun 3;29(22):3263-75. doi: 10.1038/onc.2010.76. Epub 2010 Mar 15. Oncogene. 2010. PMID: 20228841
-
Epigenetic silencing of HOPX promotes cancer progression in colorectal cancer.Neoplasia. 2012 Jul;14(7):559-71. doi: 10.1593/neo.12330. Neoplasia. 2012. PMID: 22904674 Free PMC article.
-
HOP/OB1/NECC1 promoter DNA is frequently hypermethylated and involved in tumorigenic ability in esophageal squamous cell carcinoma.Mol Cancer Res. 2008 Jan;6(1):31-41. doi: 10.1158/1541-7786.MCR-07-0213. Mol Cancer Res. 2008. PMID: 18234960
-
The homeobox only protein homeobox (HOPX) and colorectal cancer.Int J Mol Sci. 2013 Nov 25;14(12):23231-43. doi: 10.3390/ijms141223231. Int J Mol Sci. 2013. PMID: 24287901 Free PMC article. Review.
-
The role of HOPX in normal tissues and tumor progression.Biosci Rep. 2020 Jan 31;40(1):BSR20191953. doi: 10.1042/BSR20191953. Biosci Rep. 2020. PMID: 31934721 Free PMC article. Review.
Cited by
-
Epigenetics and pancreatic cancer: pathophysiology and novel treatment aspects.World J Gastroenterol. 2014 Jun 28;20(24):7830-48. doi: 10.3748/wjg.v20.i24.7830. World J Gastroenterol. 2014. PMID: 24976721 Free PMC article. Review.
-
Three-dimensional genome architecture in intrahepatic cholangiocarcinoma.Cell Oncol (Dordr). 2025 Jun;48(3):617-635. doi: 10.1007/s13402-024-01033-6. Epub 2025 Jan 20. Cell Oncol (Dordr). 2025. PMID: 39831920 Free PMC article.
-
Exploring the Role of CDO1 in Breast Cancer: Insights into Tumor Biology and Therapeutic Potential.Ann Surg Oncol. 2025 Aug 5. doi: 10.1245/s10434-025-17944-z. Online ahead of print. Ann Surg Oncol. 2025. PMID: 40762777
-
HOPX Is an Epigenetically Inactivated Tumor Suppressor and Overexpression of HOPX Induce Apoptosis and Cell Cycle Arrest in Breast Cancer.Onco Targets Ther. 2020 Jun 23;13:5955-5965. doi: 10.2147/OTT.S250404. eCollection 2020. Onco Targets Ther. 2020. PMID: 32606804 Free PMC article.
-
Higher HOPX expression is associated with distinct clinical and biological features and predicts poor prognosis in de novo acute myeloid leukemia.Haematologica. 2017 Jun;102(6):1044-1053. doi: 10.3324/haematol.2016.161257. Epub 2017 Mar 24. Haematologica. 2017. PMID: 28341738 Free PMC article.
References
Publication types
MeSH terms
Substances
LinkOut - more resources
Full Text Sources
Other Literature Sources
Medical
Research Materials
