

Body composition in obstructive sleep apneahypopnea syndrome bio-impedance reflects the severity of sleep apnea
- PMID: 22958677
- PMCID: PMC3463035
- DOI: 10.1186/2049-6958-5-1-44
Body composition in obstructive sleep apneahypopnea syndrome bio-impedance reflects the severity of sleep apnea
Abstract
Background: Obstructive sleep apnea-hypopnea syndrome (OSAHS) is characterized by repeated breathing pauses during sleep and is closely associated with obesity. Body fat is known to be a predictive factor for OSAHS and its severity.
Aim: To study the correlation between the severity of OSAHS and body composition measurements.
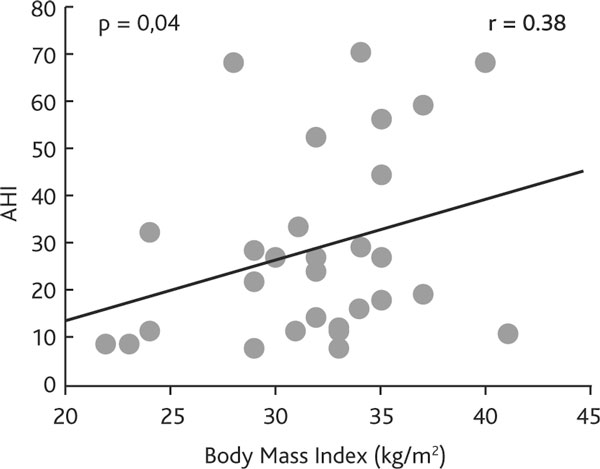
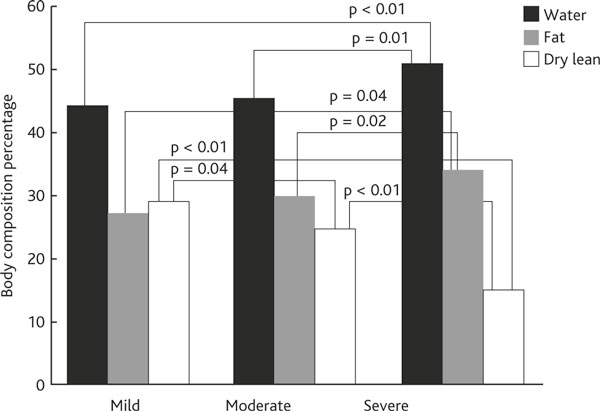
Methods: 30 patients with OSAHS (21 men, 9 women, mean age 45.1 years, mean apnea-hypopnea index = 29.6/hour) were included in the study after full polysomnography. They were divided into 3 groups according to the apnea-hypopnea index (AHI): mild OSAHS (mean AHI 10.9/h), moderate OSAHS (mean AHI 23.9/h) and severe OSAHS (mean AHI 53.9/h). Body composition (body fat, body water and dry lean mass) was assessed using bioelectric impedance assay (BIA). Other measurements included neck and abdominal circumferences and body mass index (BMI). Pearson's coefficient (r) was used to express correlations between AHI and the following parameters: BMI, neck and abdominal circumferences, body fat, dry lean mass, and body water. Wilcoxon Sum-of-Ranks (Mann-Whitney) test for comparing unmatched samples was used to compare anthropometric and body composition measurements between groups.
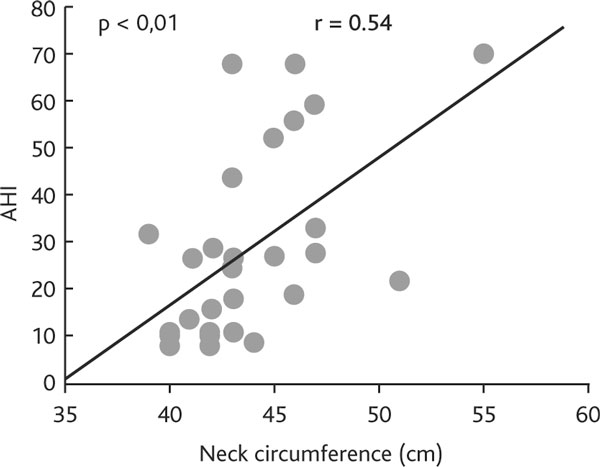
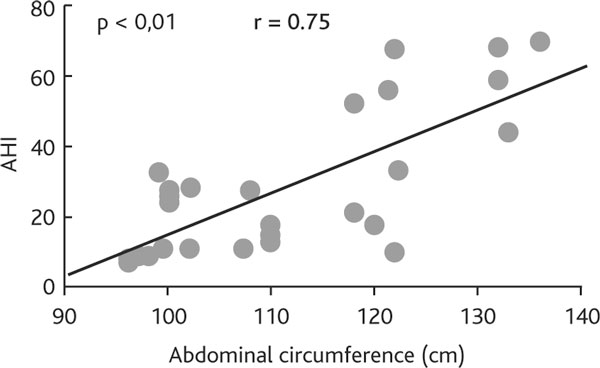
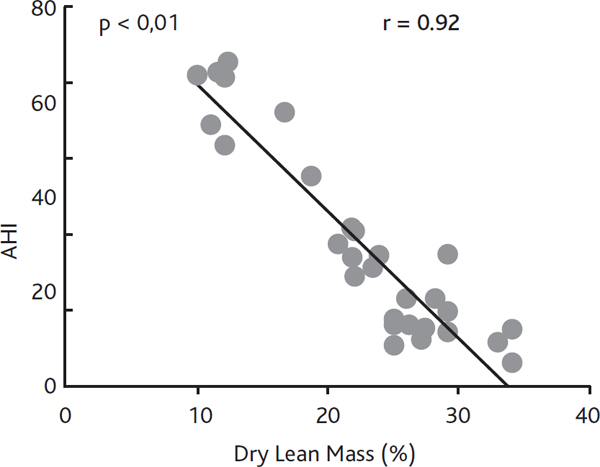
Results: The correlation between AHI and BMI was weak (r = 0.38). AHI correlated moderately with neck circumference (r = 0.54), with neck circumference corrected by height (r = 0.60), and more strongly with body fat (r = 0.67), with body water (r = 0.69) and with abdominal circumference (r = 0.75). There was a strong negative correlation between AHI and dry lean mass (r = - 0.92). There were significant differences in body fat, body water, neck circumference corrected by height and abdominal circumference (Wilcoxon Sum-of-Ranks, p < 0.01), between mild and severe OSASH groups, but not in BMI (Wilcoxon Sumof-Ranks, W = 86.5; p = 0.17).
Conclusions: In our study, the severity of OSAHS correlated with body fat and with body water more strongly than with general and cervical obesity. Abdominal adiposity may predict OSAHS severity better than neck circumference.
Figures
References
-
- Diagnostic and coding manual. 2. Westchester, IL: American Academy of Sleep Medicine; 2005. American Academy of Sleep Medicine. International classification of sleep disorders.
-
- Phillipson EA, Sleep disorders. In: Textbook of respiratory medicine. Murray JF, Nadel JA, editor. Philadelphia, PA: WB Saunders; 1988. pp. 1841–1860.
-
- Van de Graaff WB. Thoracic influence on upper airway patency. J Appl Physiol. 1988;65:2124–2131. - PubMed
-
- Romero-Corral A, Somers VK, Sierra-Johnson J, Thomas RJ, Collazo-Clavell ML, Korinek J, Allison TG, Batsis JA, Sert-Kuniyoshi FH, Lopez-Jimenez F. Accuracy of body mass index in diagnosing obesity in the adult general population. Int J Obes. 2008;32:959–966. doi: 10.1038/ijo.2008.11. - DOI - PMC - PubMed
LinkOut - more resources
Full Text Sources
