. 2012 Sep 6;75(5):786-98.
doi: 10.1016/j.neuron.2012.06.033.

How variable clones build an invariant retina

Affiliations

How variable clones build an invariant retina

Jie He et al. Neuron. .

Abstract

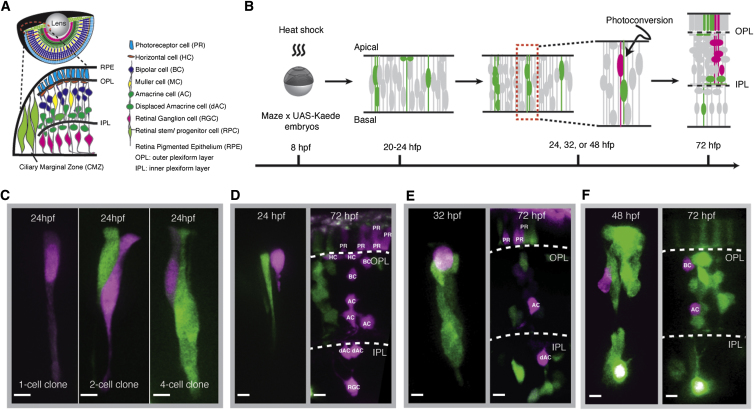
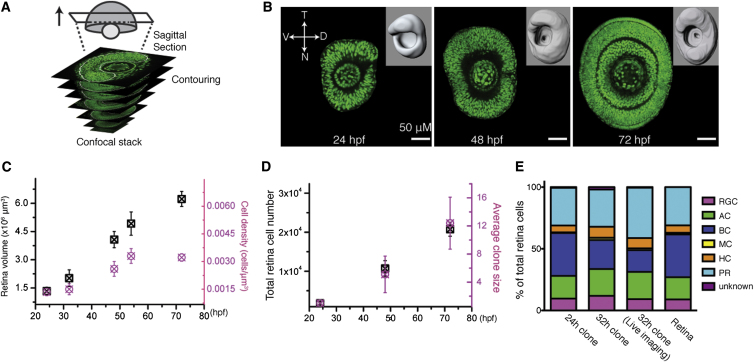
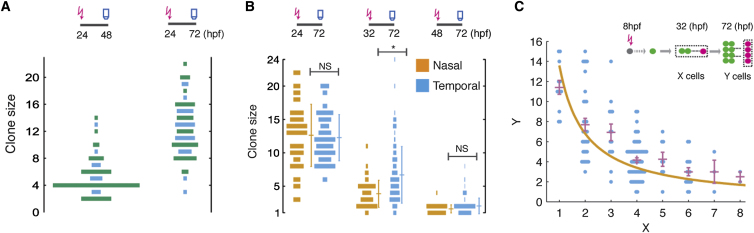
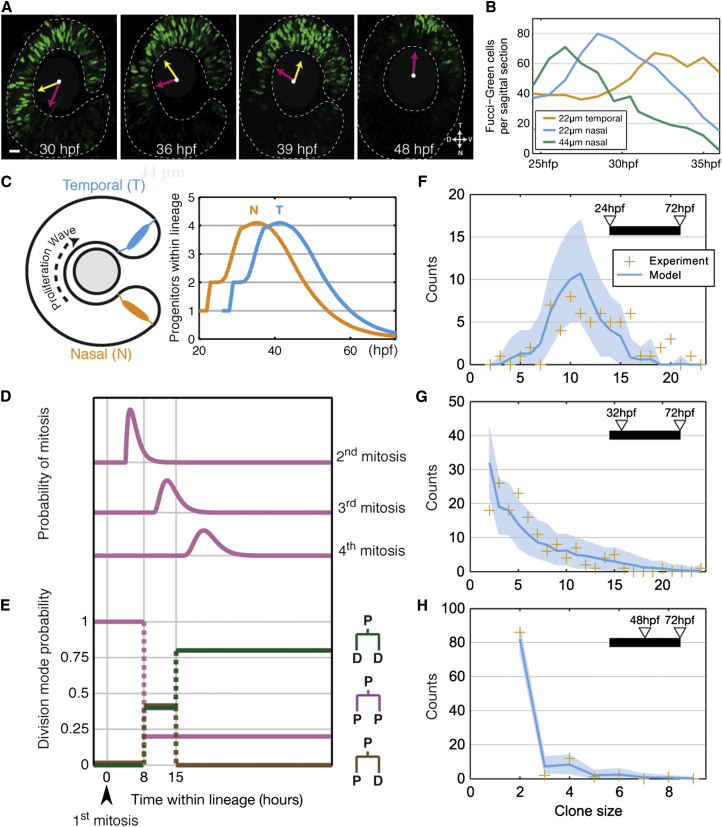
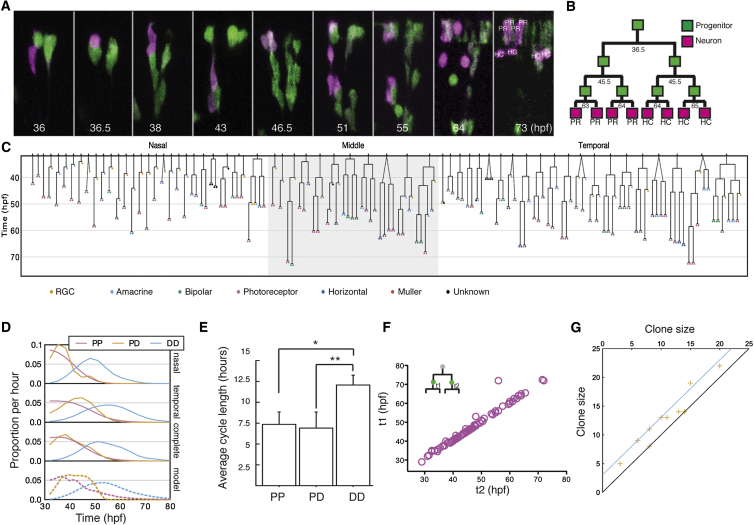
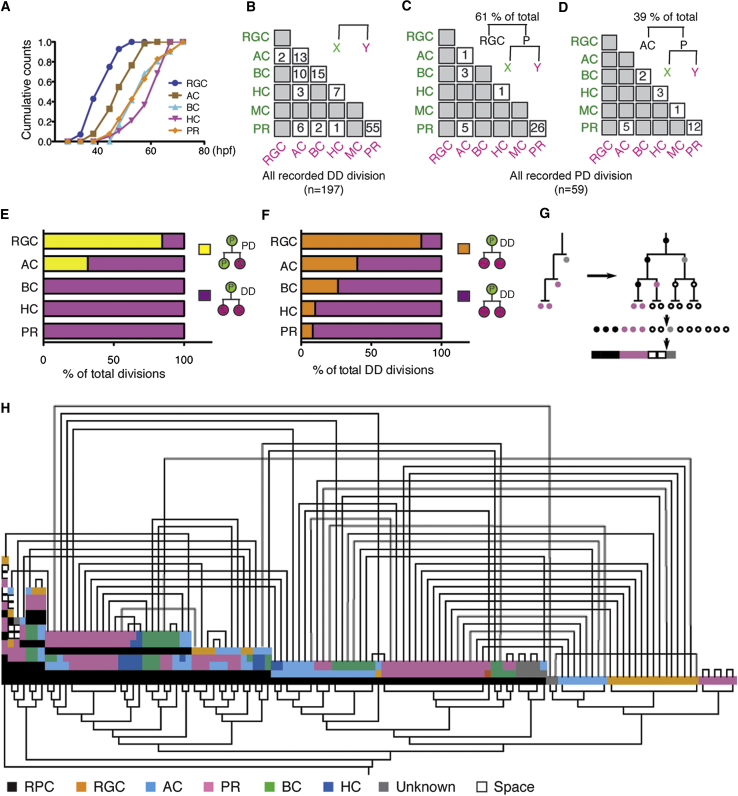
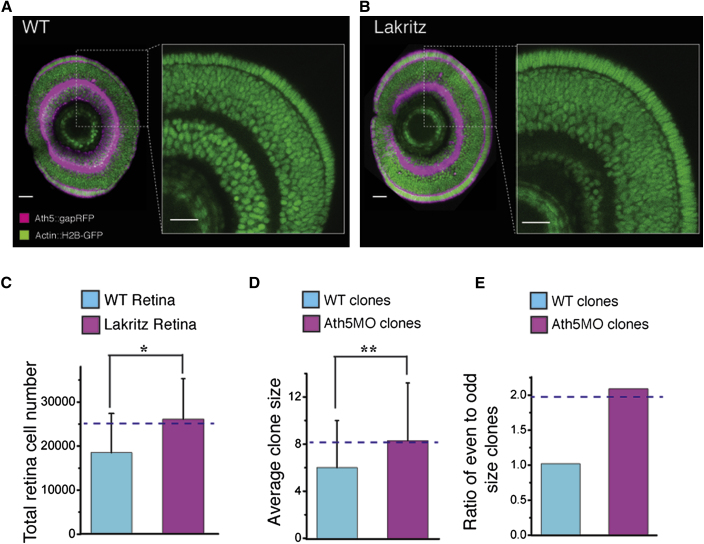
A fundamental question in developmental neuroscience is how a collection of progenitor cells proliferates and differentiates to create a brain of the appropriate size and cellular composition. To address this issue, we devised lineage-tracing assays in developing zebrafish embryos to reconstruct entire retinal lineage progressions in vivo and thereby provide a complete quantitative map of the generation of a vertebrate CNS tissue from individual progenitors. These lineage data are consistent with a simple model in which the retina is derived from a set of equipotent retinal progenitor cells (RPCs) that are subject to stochastic factors controlling lineage progression. Clone formation in mutant embryos reveals that the transcription factor Ath5 acts as a molecular link between fate choice and mode of cell division, giving insight into the elusive molecular mechanisms of histogenesis, the conserved temporal order by which neurons of different types exit the cell cycle.


Figures

Figure 1
Figure 1
In Vivo Mosaic Labeling of Single RPCs (A) A schematic of the retina and its major cell types. (B) Experimental flow of labeling and tracking a retinal clone from a photoconverted single RPC (magenta). (C) Single RPCs (magenta) photoconverted at 24 hpf from the clones of various size (green). (D–F) Single RPCs photoconverted at 24 hpf (D), 32 hpf (E), and 48 hpf (F) (magenta, left) and resultant clones (magenta, right) with cell fates identified (Figure S1). Scale bar represents 5 μm.
Figure 2
Figure 2
Retinal Clones Represent Retinal Growth (A) A schematic diagram of the retinal surface creation by contouring in sagittal sections (white dashed lines) of a confocal stack. (B) Representative images of the sagittal sections and the created retina surfaces (inserts) at distinct developmental stages. (C) Retinal volume (black) and average cell density (magenta) increase over time. Values are represented as mean ± SD (n = 8, 7, and 5 for the retinas at 24, 48, and 72 hpf). (D) Clone growth (magenta, photoconverted at 24 hpf) matches retina total cell growth (black) over time. Values are represented as mean ± SD (n = 8, 7, and 5 for the retinas at 24, 48, and 72 hpf). (E) Seventy-two hour postfertilization cell compositions of the clones photoconverted at 24 (24 hr clones, n = 64) and 32 hpf (32 hr clones, n = 169; 32 hr clone in live imaging, n = 67) are comparable to that of the retina.
Figure 3
Figure 3
Characteristics of Retinal Clone Size Evolving over Time (A) Size distributions of the clones induced at 24 hpf and recorded at 48 hpf (left) or at 72 hpf (right), highlighting numbers of even (green) versus odd (blue) clones. (B) Size distributions of clones photoconverted at various times. The mean and SD are indicated (n = 64, 169, and 163 for 24, 32, and 48 hpf; NS, not significant; p < 0.05, Student’s t test). Clones photoconverted at 48 hpf display significantly fewer three-cell than four-cell clones (two-proportion z test, p = 0.011). (C) After photoconversion at 32 hpf, the size of the resulting subclone at 72 hpf (y axis, depicted as the magenta cells in the schematic shown in inset) is, on average, approximately inversely correlated with the total size of the parent clone at 32 hpf (x axis, shown as the enclosed green and magenta cells in inset). The points show measurements from individual clones, while the mean and SEM are shown in purple. If the fate of RPCs is independent of clonally related cells, the average size of the subclone after photoconversion is predicted to vary as N/n where N denotes the average total clone size at 72 hpf and n denotes the average total clone size at 32 hpf. Indeed, the measured averages (purple) are broadly consistent with this prediction (orange line).
Figure 4
Figure 4
Stochasticity in Retinal Clone Growth (A) Sagittal slices of a geminin-GFP-expressing retina at various time points (yellow arrow points to region of highest number of mAG-zGem-labeled RPCs and magenta arrow points to region of geminin-GFP decline. (B) Quantified geminin-GFP-positive cells over time by zone (nasal or temporal zone) and depth (the distance between the most peripheral section and the section of interests). (C) Schematic showing the progression of the proliferative wave from the nasal region to the temporal region. On the right is plotted how the stochastic model (see Experimental Procedures) predicts the average number of progenitors derived from a single RPC as a function of time and nasotemporal position in the retina. (D) The probabilities in the model for the second, third, and fourth mitosis within a lineage to occur, measured against the first mitosis. (E) The time-dependent probabilities for modes of division of RPCs in the model. (F–H) Shows fits between model predictions (cyan lines with shaded blue regions show 95% plausible intervals due to finite sampling) and size distributions (orange crosses) of clones induced at 24 hpf (F), 32 hpf (G), and 48 hpf (H).
Figure 5
Figure 5
In Vivo Time Lapse of Retinal Clone Development (A) An image series of the generation of an eight-cell clone from a single RPC photoconverted at 32 hpf (magenta). (B) The schematically reconstructed lineage tree for the clone in (A). (C) Summary of 60 complete retina lineages induced at 32 hpf reconstructed from in vivo live imaging. Dashed lines indicate clones in which the first division happened between photoconversion and start of time lapse. (D) The normalized rates of different division modes evolve over time, derived from the lineages recorded in (C), compared to model prediction (dashed lines in bottom panel). (E) The bar graph shows the length of cell cycle that leads to the three division modes. PP, symmetric proliferation; PD, asymmetric differentiation; DD, symmetric differentiation. Values are represented as mean ± SEM (n = 28, 16, and 118 for PP, PD, and DD, respectively; p < 0.05, ∗∗p < 0.05; Student’s t test). (F) The division time of sister RPCs (t1 and t2) within the time window of 24 and 72 hpf, indicating the synchrony of sister divisions. (G) The correlation between sizes of sister lineages (orange crosses) compares well with the expected correlation due to synchronization of second mitosis induced by proximity in space and time of sister RPCs (cyan).
Figure 6
Figure 6
Clonal Histogenesis (A) The histogenesis of retina cells of different types derived from the live-imaging data. (B) Matrix summarizing the cell composition of 197 DD divisions. (C and D) The fate outcomes of the P progenitors of 59 PD divisions, 36 from cases in which the D cell was an RGC (C) and 23 in which it was an AC (D). (E) Bar graph showing the proportions of the PD and DD divisions in generation of distinct cell fates. (F) Bar graph showing the proportions of symmetric DD divisions (XX) and asymmetric DD divisions (XY) in generation of distinct cell fates. (G) Illustration of compressing of single lineage tree into a barcode. (H) Barcode cluster analysis of clones from (C) split into sister lineages (connected above), embedded into the smallest symmetric tree (inserting space as necessary), and converted into a barcode by a depth-first traversal to preserve structural units and hierarchically clustered according to Levenshtein distance (shown by the tree below). While sisters show similar sizes (due to their being born at the same time and place), there are no other obvious correlations between sister lineages.
Figure 7
Figure 7
Total Retinal Cell Number Increase in Ath5 Mutants Predicted by Modeling (A and B) Zoomed-in images of a retina sagittal section of wild-type (WT) (A) and lakritz (B) retina, showing cell number increase in the lakritz retina. Scale bar represents 23 μm. (C and D) Quantified increase in total cell number in the lakritz retina (C) and the average clone size in Ath5 morpholino (Ath5MO)-injected retinas (D). The dashed lines represent the model prediction. Values are represented as mean ± SD (n = 4, WT retina; n = 3, lakritz retina; n = 169, clones in the WT retina; n = 34, clones in the Ath5MO-injected retina; p < 0.05, ∗∗p < 0.05, Student’s t test). (E) Ath5MO-injected clones are biased toward even numbers, as predicted by the model (dashed line).

Comment in

References

    1. Agathocleous M., Harris W.A. From progenitors to differentiated cells in the vertebrate retina. Annu. Rev. Cell Dev. Biol. 2009;25:45–69. - PubMed
    1. Alexiades M.R., Cepko C.L. Subsets of retinal progenitors display temporally regulated and distinct biases in the fates of their progeny. Development. 1997;124:1119–1131. - PubMed
    1. Angevine J.B., Jr., Sidman R.L. Autoradiographic study of cell migration during histogenesis of cerebral cortex in the mouse. Nature. 1961;192:766–768. - PubMed
    1. Baye L.M., Link B.A. Interkinetic nuclear migration and the selection of neurogenic cell divisions during vertebrate retinogenesis. J. Neurosci. 2007;27:10143–10152. - PMC - PubMed
    1. Belecky-Adams T., Cook B., Adler R. Correlations between terminal mitosis and differentiated fate of retinal precursor cells in vivo and in vitro: analysis with the “window-labeling” technique. Dev. Biol. 1996;178:304–315. - PubMed

Publication types

LinkOut - more resources