Comparative Study
. 2012 Sep 6;75(5):875-88.
doi: 10.1016/j.neuron.2012.06.037.

Attentional stimulus selection through selective synchronization between monkey visual areas

Affiliations
Comparative Study

Attentional stimulus selection through selective synchronization between monkey visual areas

Conrado A Bosman et al. Neuron. .

Abstract

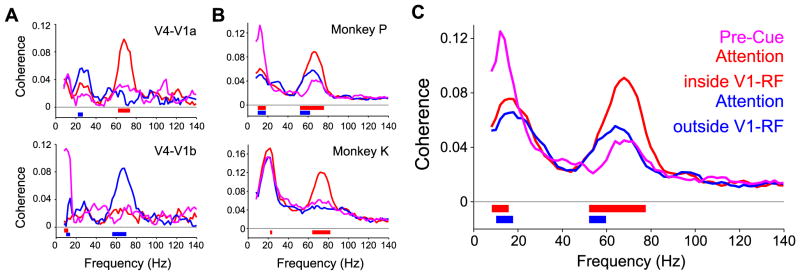
A central motif in neuronal networks is convergence, linking several input neurons to one target neuron. In visual cortex, convergence renders target neurons responsive to complex stimuli. Yet, convergence typically sends multiple stimuli to a target, and the behaviorally relevant stimulus must be selected. We used two stimuli, activating separate electrocorticographic V1 sites, and both activating an electrocorticographic V4 site equally strongly. When one of those stimuli activated one V1 site, it gamma synchronized (60-80 Hz) to V4. When the two stimuli activated two V1 sites, primarily the relevant one gamma synchronized to V4. Frequency bands of gamma activities showed substantial overlap containing the band of interareal coherence. The relevant V1 site had its gamma peak frequency 2-3 Hz higher than the irrelevant V1 site and 4-6 Hz higher than V4. Gamma-mediated interareal influences were predominantly directed from V1 to V4. We propose that selective synchronization renders relevant input effective, thereby modulating effective connectivity.


Figures

Fig. 1
Fig. 1
High density monkey ECoG grid and attention paradigm. (A) Rendering of the brain of monkey P. Lines indicate the covered area with the major sulci. Dots indicate the 252 subdural electrodes. (B) Power change relative to baseline in a V1 electrode for contra- and ipsilateral stimulation. (C) Receptive fields of the 3×5 V1 example electrodes shown in green in panel (A). (D) Receptive fields of the 3×3 V4 example electrodes shown in red in panel (A). Color bar applies to (C) and (D). (E) Selective attention paradigm. See Experimental Procedures for details. See also Figure S1.
Fig. 2
Fig. 2
Example triplet recording of one V4 and two V1 sites in monkey P. (A) Illustration of the two single-stimulus conditions, corresponding to the red/blue lines in (B) through (F). Both conditions activated V4, but only the condition labeled red (blue) activated site V1a (V1b). The double arrow illustrates the likely pattern of interaction between neuronal groups. (B) through (D): Spectral power changes (relative to pre-stimulus baseline) for the indicated sites. (E), (F) Coherence spectra for the indicated site pairs. Gray bars indicate frequencies with a significant effect (p<0.05, corrected for multiple comparisons across frequencies, non-parametric randomization across epochs). (B) through (F) use 249 epochs of 0.5 s per condition. (G) Illustration of the two attention conditions with simultaneous presentation of both stimuli and attentional selection of one or the other stimulus, corresponding to the red/blue lines in (H) through (L). The arrows indicate the selective interaction of the V4 site with the behaviorally relevant V1 site. (H) through (J) Spectral power changes (relative to pre-stimulus baseline) for the indicated sites. (K), (L) Coherence spectra for the indicated site pairs. Gray bars: Same test as in panels (E), (F). (H) through (L) use 1102 epochs of 0.5 s per condition. See also Figure S2 for absolute power spectra.
Fig. 3
Fig. 3
Analysis of GC influences for the example triplet. The spectra are GC influence spectra between the indicated sites and in the indicated direction. (B) through (E) show the results for the single-stimulus conditions illustrated in (A). (G) through (J) show the results for the two-stimulus conditions with selective attention to either stimulus, as illustrated in (F). Gray bars indicate frequencies with a significant effect (p<0.05, corrected for multiple comparisons across frequencies, non-parametric randomization across epochs).
Fig. 4
Fig. 4
Average results from the attention paradigm. (A) Average spectral power change relative to pre-stimulus baseline in V4. (B) Average spectral power change relative to pre-stimulus baseline in V1, when the stimulus activating the respective site was behaviorally relevant (red) or irrelevant (blue). (C) Average V1–V4 coherence spectrum, when the stimulus activating the respective V1 site was relevant (red) or irrelevant (blue). Gray bar indicates frequencies with a significant effect (p<0.05, corrected for multiple comparisons across frequencies, non-parametric randomization across site pairs). (D), (E) show the same analysis as (C), but separately for monkey P and K. (F) Scatter plot with each dot corresponding to a V1–V4 site pair and a recording session, comparing attention outside the V1-RF (x-axis) to attention inside the V1-RF (y-axis).
Fig. 5
Fig. 5
The gamma peaks of the two monkeys. All panels show the individual gamma peaks of the indicated monkeys. Area (combinations) and attention conditions are color coded as indicated at the top. The values of visually induced power and of coherence were divided by their respective maximum values in order to scale all peaks to unit peak height and thereby ease direct comparison of peak frequencies. Scaled spectra are shown as dots. Gaussians were fitted to the top third of each peak and are shown as solid lines (all r-square values were above 0.98). The panels on the right show the peaks in detail. The Gausians’ means, i.e. the gamma-band peaks, are shown as vertical lines (shaded regions correspond to 95% confidence bounds) and as numbers. See also Figure S5.
Fig. 6
Fig. 6
Average GC influences. Each panel shows the average GC influences for the indicated monkeys, attention conditions and directions. Gray bars indicate frequencies with a significant effect (p<0.05, corrected for multiple comparisons across frequencies, non-parametric randomization across site pairs). See also Figure S3 for the same analysis after stratification for signal-to-noise ratios.
Fig. 7
Fig. 7
Coherence spectra before and after cue presentation. (A) Coherence spectra between V4 and the indicated V1a site (same sites as Fig. 2). The pink spectrum is from the pre-cue epoch. The red (blue) spectrum is from the post-cue epoch with attention inside (outside) the V1-RF. Colored bar(s) indicate significant differences between the pre-cue spectrum and the spectrum with the same color as the significance bar (p<0.05, corrected for multiple comparisons across frequencies, non-parametric randomization across epochs). (B) Same as (A), but giving the averages for the indicated monkeys, and with statistics based on non-parametric randomization across site pairs. (C) Same as (B), but giving the average across both monkeys. Please note that the post-cue coherence spectra are not identical to those shown in Fig. 2 and 4, because there were less pre-cue than post-cue epochs available and we therefore randomly subsampled post-cue epochs to equate epoch numbers and avoid respective biases in the coherence estimate.
Fig. 8
Fig. 8
Cross-frequency analysis of inter-areal synchronization as a function of time around the theta peak. (A) V1–V4 coherence as a function of time relative to peaks in the 4 Hz rhythm. (B) Coherence between V1 and V4 in a 70–80 Hz band, as a function of time relative to peaks in the 4 Hz rhythm. Data are from monkey K. See figure S4 for data from monkey P.

Comment in

References

    1. Akam T, Kullmann DM. Oscillations and filtering networks support flexible routing of information. Neuron. 2010;67:308–320. - PMC - PubMed
    1. Barone P, Batardiere A, Knoblauch K, Kennedy H. Laminar distribution of neurons in extrastriate areas projecting to visual areas V1 and V4 correlates with the hierarchical rank and indicates the operation of a distance rule. J Neurosci. 2000;20:3263–3281. - PMC - PubMed
    1. Bichot NP, Rossi AF, Desimone R. Parallel and serial neural mechanisms for visual search in macaque area V4. Science. 2005;308:529–534. - PubMed
    1. Börgers C, Kopell NJ. Gamma oscillations and stimulus selection. Neural Comput. 2008;20:383–414. - PubMed
    1. Bosman CA, Womelsdorf T, Desimone R, Fries P. A microsaccadic rhythm modulates gamma-band synchronization and behavior. J Neurosci. 2009;29:9471–9480. - PMC - PubMed

Publication types