. 2012 Sep 7;11(3):346-58.
doi: 10.1016/j.stem.2012.05.027.

FLT3-ITD knockin impairs hematopoietic stem cell quiescence/homeostasis, leading to myeloproliferative neoplasm

Affiliations

FLT3-ITD knockin impairs hematopoietic stem cell quiescence/homeostasis, leading to myeloproliferative neoplasm

S Haihua Chu et al. Cell Stem Cell. .

Abstract

Internal tandem duplication (ITD) mutations within the FMS-like tyrosine kinase-3 (FLT3) render the receptor constitutively active driving proliferation and survival in leukemic blasts. Expression of FLT3-ITD from the endogenous promoter in a murine knockin model results in progenitor expansion and a myeloproliferative neoplasm. In this study, we show that this expansion begins with overproliferation within a compartment of normally quiescent long-term hematopoietic stem cells (LT-HSCs), which become rapidly depleted. This depletion is reversible upon treatment with the small molecule inhibitor Sorafenib, which also ablates the disease. Although the normal LT-HSC has been defined as FLT3(-) by flow cytometric detection, we demonstrate that FLT3 is capable of playing a role within this compartment by examining the effects of constitutively activated FLT3-ITD. This indicates an important link between stem cell quiescence/homeostasis and myeloproliferative disease while also giving novel insight into the emergence of FLT3-ITD mutations in the evolution of leukemic transformation.


Figures

Figure 1
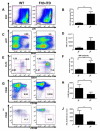
Figure 1. Expression of FLT3-ITD from the endogenous promoter disrupts HSPC composition in knock-in mice
Representative flow cytometric analyses and quantification of HSPC populations in bone marrow from WT and FLT3-ITD littermates. (A, B) Lineage negative compartment (C, D) KSLs (Lin c-kit+ sca-1+) (E) LT-HSC, ST-HSC, and MPP populations by CD34 and Flt3 expression within the KSL population (F) Total bone marrow cellularity (G, H) SLAM populations (Lin CD150+CD48) (I, J) KSL-SLAM populations (Lin c-kit+ sca-1+ CD150+ CD48) Data is representative of 3 independent experiments. p<0.05 (*)
Figure 2
Figure 2. FLT3-ITD bone marrow demonstrates reduced Side Population and HSC function
(A) Representative flow analysis of Side Population cells by Hoechst dye efflux in WT and FLT3-ITD mice (n=6) (B) verapamil control (C) overlap of Hoechst efflux activity within KSL populations (n=6) (D) Lethally irradiated recipient mice (CD45.1) were injected with CD45.2 bone marrow cells from WT or FLT3-ITD donors. For total bone marrow (tBM) experiments 2×10⁶ tBM donor cells were injected with 5×10⁵ CD45.1 helper cells. For Lin and KSL transplants, 1×10⁵ Lin cells or 5,000 KSLs were injected with 1×10⁶ WT CD45.1 tBM helper cells (n=5 mice for each group) Mice were bled at 4 weeks post-transplant and analyzed for ratio of CD45.2 to CD45.1 in peripheral blood. Data is representative of 3 independent experiments. p<0.05 (*), p<0.01 (**), and not significant (ns).
Figure 3
Figure 3. Transplantation of SLAM cells recapitulates MPN phenotypes
(A)Transplantation of either 500 WT or ITD CD45.2 SLAM sorted cells (LinCD150+CD48) into lethally irradiated recipients (CD45.1) with 100,000 Sca-1 depleted CD45.1 helper cells (n=4 for WT mice, n=5 ITD mice). Peripheral blood was measured for CD45.2 contribution at each time point shown. These data are representative of 2 independent experiments. (B) Representative spleen weights from primary transplants (C) Percent of WBM staining negative for Lineage markers (D) Percent of WBM positive for myeloid markers Mac-1 and Gr-1 (E) SLAM cell percentage of WBM. Mice were sacrificed and analyzed for disease progression 8 weeks post-transplant. These data are representative of 2 independent experiments with n= 4 mice. p<0.05 (*) and p<0.01 (**)
Figure 4
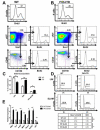
Figure 4. Flt3 is detected in SLAM cells and capable of exerting functional effects in LT-HSCs
(A) Flt3 expression measured by quantitative PCR in sorted SLAM cells from WT or Flt3-ITD mice. Results shown are the average of three independent experiments + SEM, normalized to internal control RPS16. Data is normalized to baseline Flt3 expression in WT SLAM cells. p<0.01. (B) Representative flow analysis of Lin and SLAM cell compartment in for expression of total Flt3 protein (surface and intracellular). Results shown are compared to isotype controls. Data is representative of 3 independent experiments. p<0.01 (Lin-), p<0.05 (SLAM) (C) Representative flow analysis of SLAM cell frequency in bone marrow of chimeric mice containing both WT (CD45.1) and Flt3-ITD (CD45.2) bone marrow (n=4 mice). Data is representative of 3 independent experiments, see also Table S2. p<0.05
Figure 5
Figure 5. Flt3-ITD HSCs demonstrate increased proliferation and cell cycle entry
Bone marrow was harvested from (A) WT and (B) Flt3-ITD mice 24 hours after BrdU injection. FACS plots represent 2-3 pooled mice and are representative of data from two independent experiments. Lineage-depleted marrow was stained for KSL and SLAM markers as well as for BrdU incorporation. (C) Quantification of BrdU incorporation in Lin, KSL, and KSL-SLAM stem cell subsets. (D) PI staining of Lin progenitors or SLAM cells from one representative experiment of WT vs. Flt3-ITD mice. Gates shown represent percentage of cells in S+G2/M phase. Data is representative of three independent experiments and summarized with SEM. (E) Quantitative PCR of predicted FLT3 targets, Stat5 targets and cell cycle regulators. SLAM cells were sorted from pools of 3-4 WT or Flt3-ITD mice, and results shown are the average of three independent experiments + SEM. All readings were normalized to internal control RPS16 and set to a baseline of 1 for expression in WT SLAM cells. p<0.05(*), p<0.01(**) and not significant (ns).
Figure 6
Figure 6. Early treatment with Sorafenib prevents MPN and preserves stem cell numbers
WT females were bred to a heterozygous Flt3-ITD male and treated with Sorafenib starting at E.15 through weaning of pups at 2 weeks of age.. Data is representative of three independent experiments. (A) Spleens harvested from untreated pups vs. those treated with Sorafenib. Flt3-ITD mice are noted with (#). Spleen weight is quantified by genotype in right panel. (B, C, D, E) Quantification of percentage of bone marrow comprising (B) Lin progenitors, (C) KSLs, (D) SLAM cells, or (E) KSL-SLAM cells in treated vs. untreated WT and Flt3-ITD mice. p<0.05 (*) and p<0.01 (**).
Figure 7
Figure 7. Treatment of adult mice with Sorafenib restores stem cell activity and reverses signs of disease
Adult mice 8 weeks of age were treated daily with Sorafenib (sb) for 2 weeks. Data represents averages of 4 mice per group and is representative of two independent experiments. (A) Quantification of spleen weight for treated vs. untreated adult mice. (B, C, D, E) Quantification of percentage of bone marrow comprising (B) Lin progenitors, (C) KSLs, (D) SLAM cells, or (E) KSL-SLAM cells in treated vs. untreated adult mice. (F) 100,000 CD45.2 lineage-depleted donor cells from treated or untreated WT or Flt3-ITD mice were transplanted along with 1×10⁶ CD45.1 whole bone marrow helper cells into lethally irradiated CD45.1 recipients. Peripheral blood was analyzed for percent donor engraftment 4 weeks post-transplant. p value of WT and WT+sb was not significant (p>0.05). (G) H&E histopathology showing bone marrow (top row) and spleen (bottom row) architecture in treated and untreated adult WT and Flt3-ITD mice (WP = White Pulp, RP = Red Pulp). p<0.05 (*), p<0.01 (**) and not significant (ns)

References

    1. Adolfsson J, Borge OK, Bryder D, Theilgaard-Monch K, Astrand-Grundstrom I, et al. Upregulation of FLT3 expression within the bone marrow Lin(−)Sca1(+)c-kit(+) stem cell compartment is accompanied by loss of self-renewal capacity. Immunity. 2001;15:659–69. - PubMed
    1. Akala OO, Clarke MF. Hematopoietic stem cell self-renewal. Curr Opin Genet Dev. 2008;16:496–501. - PubMed
    1. Auclair D, M. D, Yatsula V, Pickett W, Carter C, Chang Y, et al. Antitumor activity of sorafenib in FLT3-driven leukemic cells. Leukemia. 2007;21:439–445. - PubMed
    1. Basham B, S. M, Grein J, McClanahan T, D’Andrea A, Lees E, Rascle A. In vivo identification of novel STAT5 target genes. Nucleic Acids Res. 2008;36:3802–3818. - PMC - PubMed
    1. Boyer SW, Schroeder AV, Smith-Berdan S, Forsberg EC. All Hematopoietic Cells Develop from Hematopoietic Stem Cells through Flk2/FLT3-Positive Progenitor Cells. Cell Stem Cell. 2011;9:65–73. - PMC - PubMed

Publication types

MeSH terms