. 2012 Sep 7;11(3):429-39.
doi: 10.1016/j.stem.2012.06.009.

mTOR complex 1 plays critical roles in hematopoiesis and Pten-loss-evoked leukemogenesis

Affiliations

mTOR complex 1 plays critical roles in hematopoiesis and Pten-loss-evoked leukemogenesis

Demetrios Kalaitzidis et al. Cell Stem Cell. .

Abstract

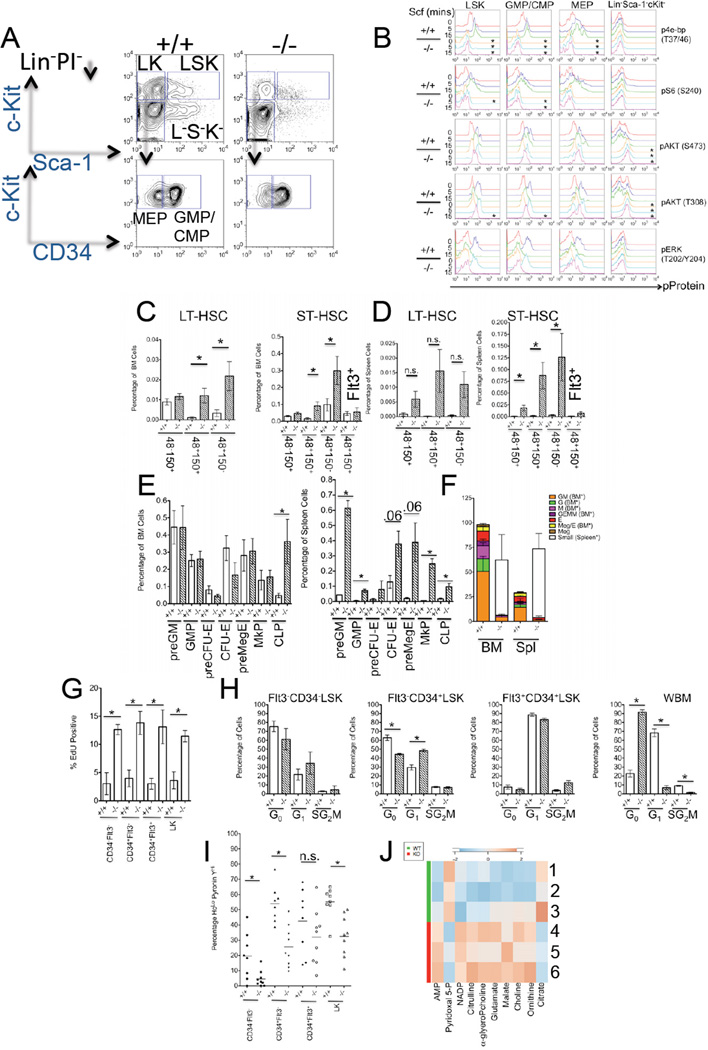
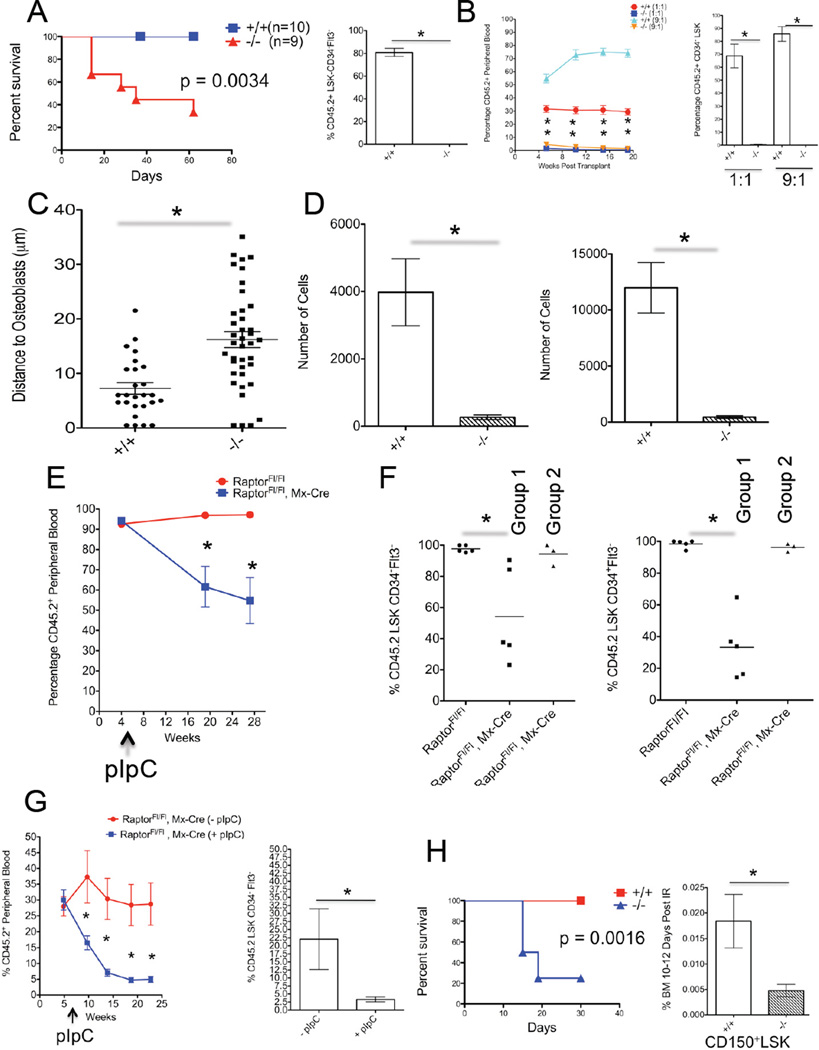
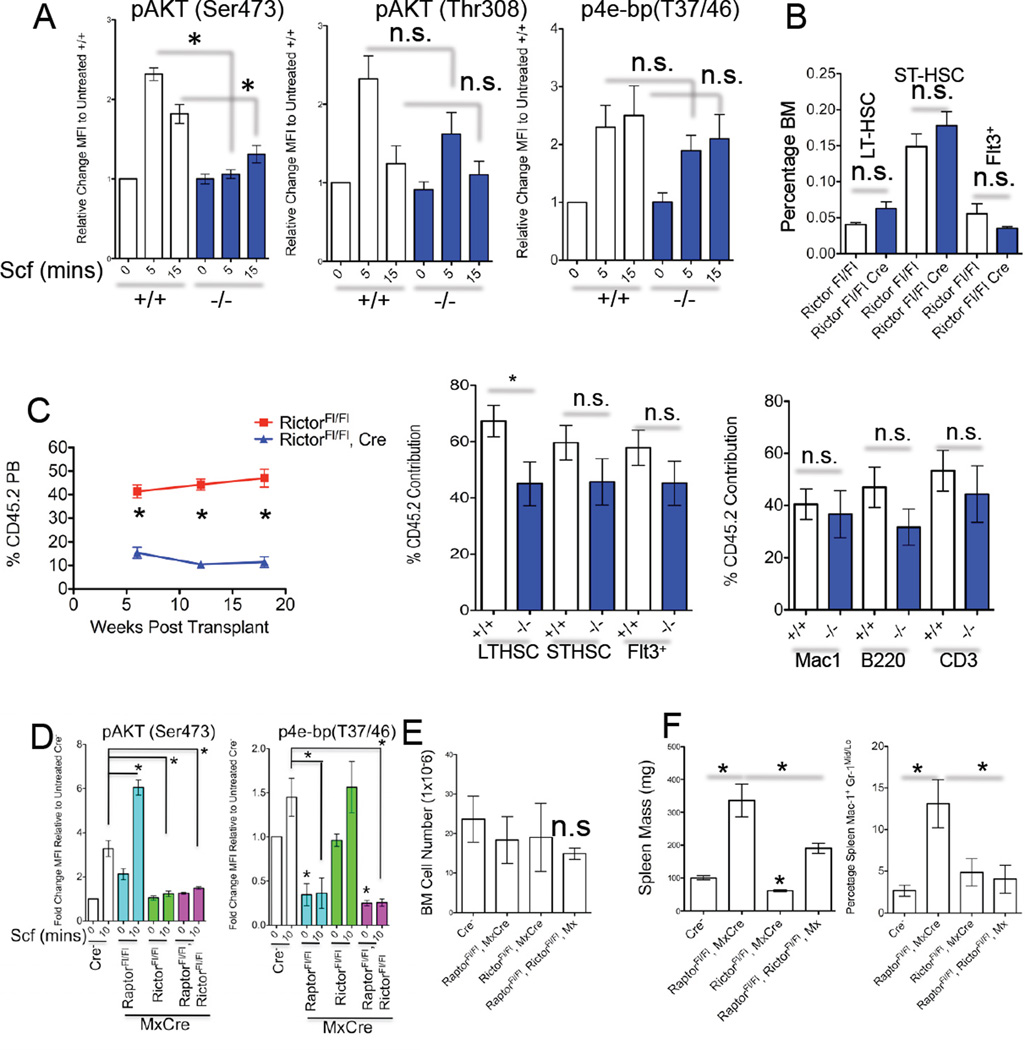
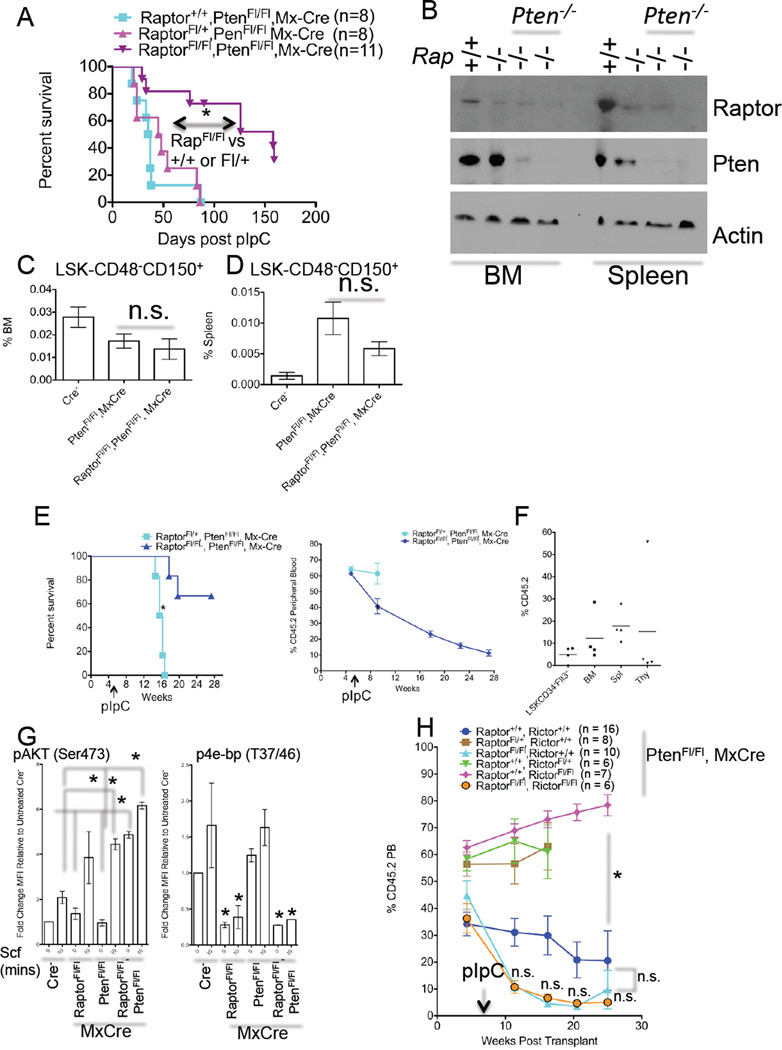
The mechanistic target of rapamycin (mTOR) pathway serves as a key sensor of cellular-energetic state and functions to maintain tissue homeostasis. Hyperactivation of the mTOR pathway impairs hematopoietic stem cell (HSC) function and is associated with leukemogenesis. However, the roles of the unique mTOR complexes (mTORCs) in hematopoiesis and leukemogenesis have not been adequately elucidated. We deleted the mTORC1 component, regulatory-associated protein of mTOR (Raptor), in mouse HSCs and its loss causes a nonlethal phenotype characterized by pancytopenia, splenomegaly, and the accumulation of monocytoid cells. Furthermore, Raptor is required for HSC regeneration, and plays largely nonredundant roles with rapamycin-insensitive companion of mTOR (Rictor) in these processes. Ablation of Raptor also significantly extends survival of mice in models of leukemogenesis evoked by Pten deficiency. These data delineate critical roles for mTORC1 in hematopoietic function and leukemogenesis and inform clinical strategies based on chronic mTORC1 inhibition.


Figures

Figure 1
Figure 1. Deletion of Raptor Ablates mTORC1 Activity and Leads to HSPC Pertubations
(A) Representative flow-cytometry plots of sorted Lin PI cells post fixation and permeabilization from pIpC-treated RaptorFl/Fl (+/+) and Raptor Fl/Fl , Mx-Cre (−/−) mice (Lin PI Sca-1+c-Kit+ [LSK], Lin PI Sca-1c-Kit+[LK], Lin PI Sca-1c-Kit+CD34+ [GMP/CMP], Lin PI Sca-1c-Kit+CD34 [MEP], and Lin PI Sca-1c-Kit[L S K]). (B) Flow cytometry was performed on sorted LinPI cells from pIpC-treated RaptorFl/Fl (+/+) and Raptor Fl/Fl, Mx-Cre (−/−) mice that were stimulated ex vivo with 20 ng/mL of Scf for the indicated time points in minutes (mins), and then processed for flow cytometry. Representative histograms are shown (% maximal value on the y-axis) and for quantification see Figure S1E (*p<0.05 relative to unstimulated +/+ controls). (C) Quantification of CD48/CD150/CD34/Flt3/LSK subsets from BM and spleen (D) of RaptorFl/Fl (+/+) and Raptor Fl/Fl, Mx-Cre (−/−) mice 5–7 months post pIpc. (n=5 +/+, n=6 −/−). For gating see Figure S1N. (E) Quantification of immunophenotypic HPC subsets from mice described in (C), from BM (left panel) and spleen (right panel). Immunophenotypes are defined as in Pronk et al., 2007. (F) CFC formation from pIpC-treated RaptorFl/Fl (+/+) and Raptor Fl/Fl, Mx-Cre (−/−) mouse BM and spleen cells. (n=3–4). (G) Assessment of EdU incorporation in cells from pIpC-treated RaptorFl/Fl (+/+) and Raptor Fl/Fl , Mx-Cre (−/−) mice. (n=3). (H) Ho 33342/Ki-67 staining from the indicated FACS-sorted LSK populations or whole BM (WBM) and pIpC-treated genotypes. G0 (2N DNA-Ki67Lo), G1 (2N DNA-Ki67Hi), and SG2M (>2N DNA-Ki67Hi) (n=3). (I) Ho 33342/Pyronin Y in the indicated surface-stained populations of the indicated genotypes (as in [B]) by flow cytometry). HoLo = 2N DNA. (n=8–9) (J) Heat-map of metabolite measurements from pIpC-treated RaptorFl/Fl (WT [1–3]) and Raptor Fl/Fl, Mx-Cre (KO [4–6]) LSK cells. (p<0.057, citrate p=0.077) (A–J) Data are expressed as mean or mean ± SEM (*p<0.05, n.s. p>0.05).
Figure 2
Figure 2. Raptor Is Required for HSC Regeneration in a Cell-Autonomous Manner
(A) 8 × 10⁵ whole BM cells from pIpC-treated RaptorFl/Fl (+/+) or Raptor Fl/Fl, Mx-Cre (−/−) mice (both CD45.2+) were transplanted into lethally-irradiated CD45.1 mice and survival was monitored. Numbers of recipient mice are indicated (left panel). (p value was derived by Log-rank Test). BM from surviving mice was analyzed for CD45.2 cell contribution to the CD34Flt3LSK pool 20 weeks post pIpC (n=3) (right panel). (B) BM cells from RaptorFl/Fl (+/+) and Raptor Fl/Fl, Mx-Cre (−/−) mice, 6 weeks post pIpC treatment (both CD45.2+), were mixed at the indicated ratios with CD45.1+ BM cells and transplanted into lethally-irradiated CD45.1 recipients. Percentage of CD45.2+ cells in PB is shown over time (n=5) (left panel). 22 weeks post transplantation the percentage of CD45.2+ CD34LSK cells in BM was assessed (n=5) (right panel). (C) FACS-sorted DiD-labeled LSK-CD48CD150+ from pIpC-treated RaptorFl/Fl(+/+) and Raptor Fl/Fl, Mx-Cre (−/−) mice were transplanted into lethally-irradiated Col2.3GFP mice and ~24 hrs later live imaging was performed to assess relative distance of HSPC to osteoblasts. Shown are results from 2 independent experiments performed with 5,000–10,000 HSPC. (D) 200 LT-HSC or ST-HSC from pIpC-treated RaptorFl/Fl (+/+) and Raptor Fl/Fl, Mx-Cre (−/−) mice were used to initiate cultures in serum-free conditions that promote HSC expansion ex vivo. 7–9 days post culture the number of cells was enumerated. Data are from 3 independent experiments performed in duplicate. (E) 8 × 10⁵ BM cells from non pIpC-treated RaptorFl/Fl or Raptor Fl/Fl, Mx-Cre mice were transplanted into lethally-irradiated CD45.1 recipients. 5 weeks post transplantation mice were injected with 3 doses of pIpC over 5 days. PB chimerism was assessed by measuring the contribution of CD45.2+ cells over the indicated time (n=9–10 recipients). (F) BM from mice from (E) was analyzed for CD45.2 chimerism in CD34Flt3-LSK fractions 25 weeks post pIpC. Raptor Fl/Fl, Mx-Cre recipients were separated into two CD45.2+ groups, one with low CD45.2 chimerism that retained deletion (Group1) and ones with high CD45.2 chimerism that escaped deletion (Group 2). (n=4–5). (See Figure S2C). (G) 2.5 × 10⁵ BM cells from uninduced Raptor Fl/Fl, Mx-Cre were mixed with 2.5 × 10⁵ CD45.1 cells and transplanted into lethally-irradiated CD45.1 recipients. 5.7 weeks post transplantation ½ of the mice were injected with pIpC as in (D) (+pIpC). Contribution of CD45.2 cells to PB was assessed over the indicated time points. (n=6–8) (left panel). Recipient BM was analyzed for CD45.2 cell contribution to the CD34Flt3-LSK pool 21 weeks post pIpC (n=6–8) (right panel). (H) Kaplan-Meier (KM) survival curve from pIpC-treated RaptorFl/Fl (+/+), n=10, and Raptor Fl/Fl, Mx-Cre (−/−), n=4, mice that received sub-lethal irradiation. The one surviving −/− mouse had escaped deletion (data not shown) (left panel). (p value was derived by Log-rank Test). pIpC-treated RaptorFl/Fl (+/+) and Raptor Fl/Fl, Mx-Cre (−/−) mice received sub-lethal irradiation and shown is the frequency of BM CD150+-LSK cells 10–12 days post irradiation (IR). (n=4). (A–H) Data are expressed as mean or mean ± SEM (*p<0.05).
Figure 3
Figure 3. Rictor is Required for mTORC2 Activity in HSPC, but Not LT-Hematopoietic Regeneration
(A) Flow cytometry was performed on sorted LINPI cells from pIpC-treated RictorFl/Fl (+/+) and Rictor Fl/Fl, Mx-Cre (−/−) mice that were treated with Scf for the indicated time (mins). Shown are data from fixed/permeablized LSK-gated events and fold change in MFI for the indicated p-protein is shown relative to untreated +/+ cells. (n=3–4 mice). (B) Frequency of BM LSK subsets from RictorFl/Fl (+/+) and Rictor Fl/Fl, Mx-Cre (−/−) mice 4 months post pIpC treatment. (n=4–5). (C) 5 × 10⁵ whole BM cells from pIpC-treated RictorFl/Fl (+/+) and Rictor Fl/Fl, Mx-Cre (−/−) mice, (both CD45.2+), were mixed with the same amount of CD45.1+ BM cells and transplanted into lethally-irradiated CD45.1 recipients. The percentage of CD45.2+ cells in PB is shown over the indicated time (n=6–7 recipients). Panels on the right show the % contribution of CD45.2+ cells to the indicated BM populations 30 weeks post transplantation. Data are from 1 of 2 experiments. (D) The levels of indicated p-proteins were assessed as in (A) in Scf-treated LSK-gated cells from pIpC-treated mice of the indicated genotypes. (n=3–4 mice per genotype) (E) BM cell number (n=2–9), spleen mass (F) (n=5–9) and percentage of Mac-1 +Gr-1Mid/Lo splenic cells (F right panel) (n=3–5) are shown from mice of the indicated genotype 1–3 months post pIpC treatment. (A–F) Data are expressed as mean ± SEM (*p<0.05, n.s. p>0.05).
Figure 4
Figure 4. Raptor is Required for Efficient Leukemogenesis Evoked by Pten Loss
(A) KM curve from PtenFl/Fl, MxCre mice of the indicated Raptor genotypes that were treated with pIpC. Number of mice is indicated (*p<0.05 Log-rank Test). (B) Western blots were performed with BM and spleen extracts from mice of the indicated genotypes ~6 months post pIpC using the indicated antibodies. Shown are samples from 2 individual pIpC-treated RaptorFl/Fl, PtenFl/Fl, MxCre mice. (C) The frequency of BM and Splenic (D) LSK-CD48CD150+ cells was assessed from mice of the indicated genotypes 2.5–5 weeks post pIpC treatment (n=6–10). (E) 1 × 10⁶ BM cells from non pIpC-treated mice of the indicated genotypes (CD45.2) were mixed with 5 × 10⁵ CD45.1 cells and transplanted into lethally-irradiated CD45.1 mice. 5.5 weeks post transplant mice received 3 injections of pIpC over 6 days. Survival (left) and chimerism (right) were then assessed (n=4–6, *p<0.05 Log-rank Test). (F) Chimerism was assessed from mice described in (E). (n=4) (G) Assessment of p-protein levels in LSK-gated events from Scf-treated LIN-PI-cells of the indicated gentoypes (n=2–3). (H) BM cells from mice of the indicated genotypes (all from PtenFl/Fl, MxCre backgrounds) were transplanted and treated as in (D). Number of transplant recipients is indicated. (A–H). Data are expressed as mean or mean ± SEM. (*p<0.05, n.s. p>0.05).

Comment in

References

    1. Campbell TB, Basu S, Hangoc G, Tao W, Broxmeyer HE. Overexpression of Rheb2 enhances mouse hematopoietic progenitor cell growth while impairing stem cell repopulation. Blood. 2009;114:3392–3401. - PMC - PubMed
    1. Carracedo A, Pandolfi PP. The PTEN-PI3K pathway: of feedbacks and cross-talks. Oncogene. 2008;27:5527–5541. - PubMed
    1. Chen C, Liu Y, Liu R, Ikenoue T, Guan K-L, Zheng P. TSC-mTOR maintains quiescence and function of hematopoietic stem cells by repressing mitochondrial biogenesis and reactive oxygen species. J. Exp. Med. 2008;205:2397–2408. - PMC - PubMed
    1. Chapuis N, Tamburini J, Green AS, Willems L, Bardet V, Park S, Lacombe C, Mayeux P, Bouscary D. Perspectives on inhibiting mTOR as a future treatment strategy for hematological malignancies. Leukemia. 2010;23:1686–1699. - PubMed
    1. Christensen JL, Weissman IL. Flk-2 is a marker in hematopoeietic stem cell differentiation: A simple method to isolate long-term stem cells. Proc. Natl. Acad. Sci. USA. 2001;98:14541–14546. Genet. 7, 606–619. - PMC - PubMed

Publication types

MeSH terms

Substances

Associated data