. 2012 Sep 14;150(6):1274-86.
doi: 10.1016/j.cell.2012.04.040. Epub 2012 Sep 5.

Circuitry and dynamics of human transcription factor regulatory networks

Affiliations

Circuitry and dynamics of human transcription factor regulatory networks

Shane Neph et al. Cell. .

Abstract

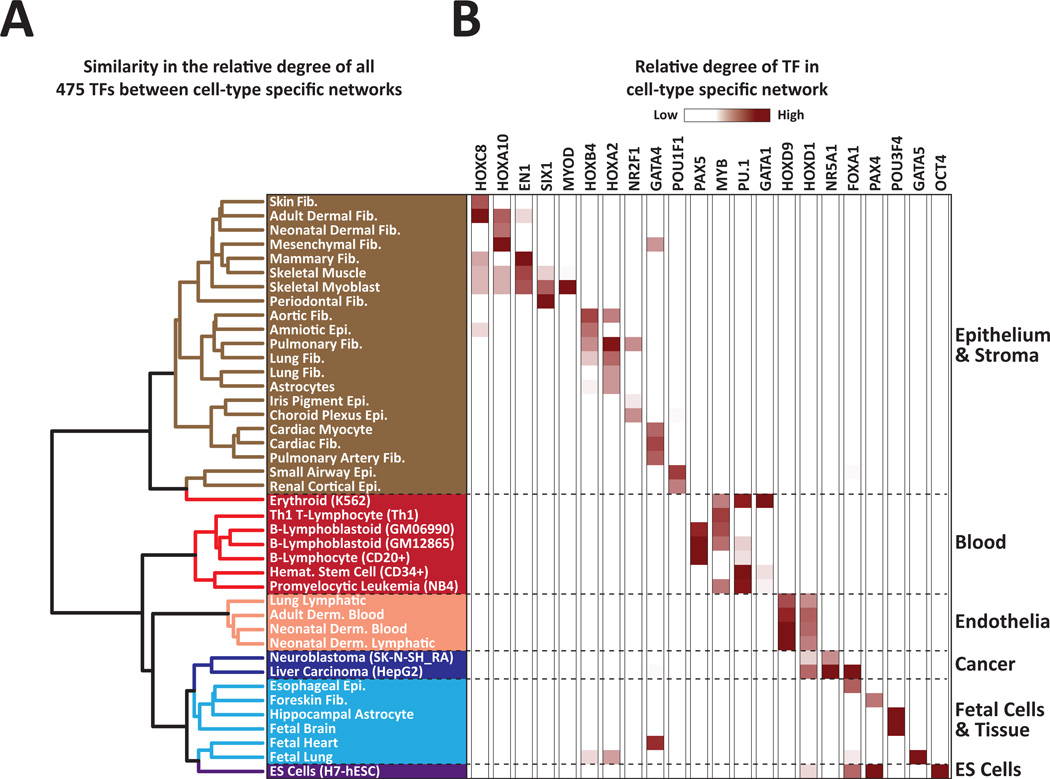
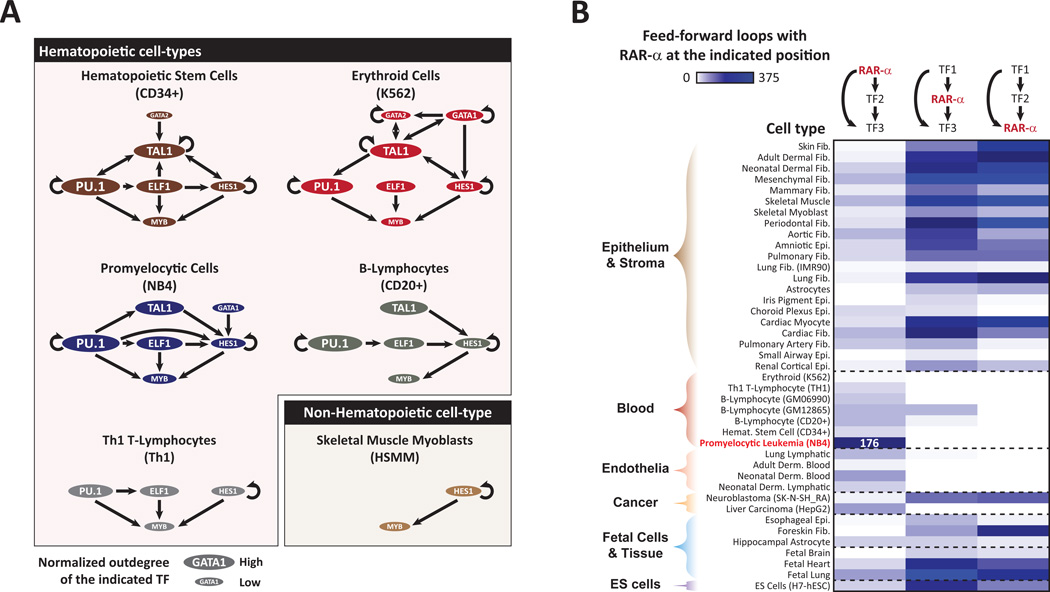
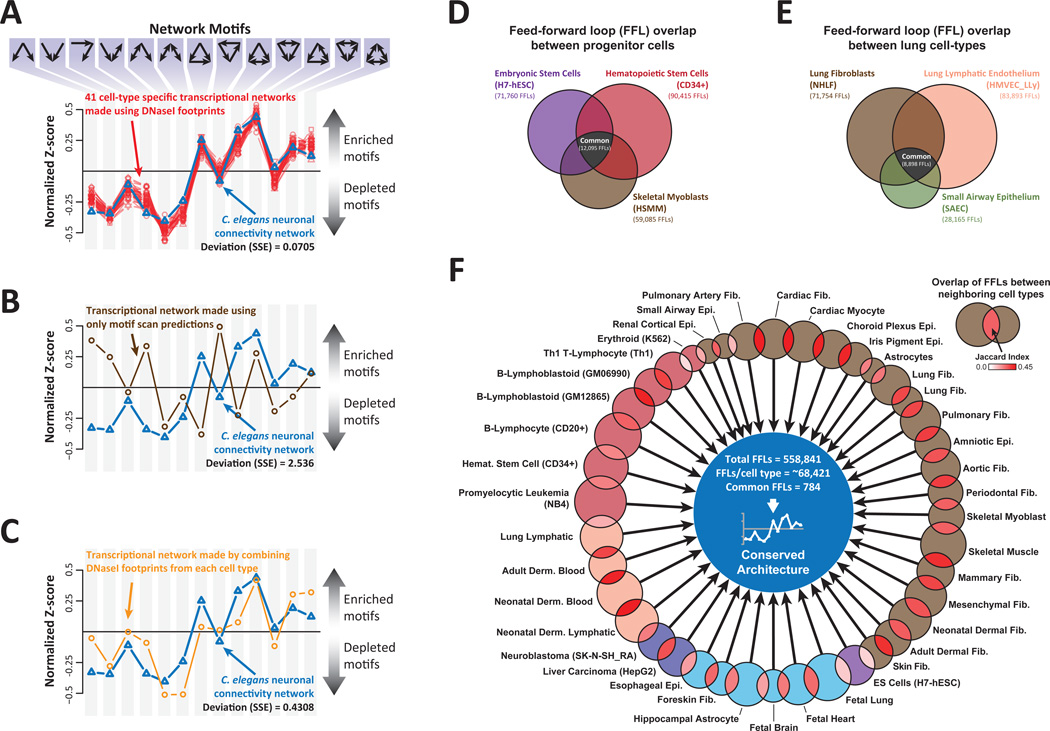
The combinatorial cross-regulation of hundreds of sequence-specific transcription factors (TFs) defines a regulatory network that underlies cellular identity and function. Here we use genome-wide maps of in vivo DNaseI footprints to assemble an extensive core human regulatory network comprising connections among 475 sequence-specific TFs and to analyze the dynamics of these connections across 41 diverse cell and tissue types. We find that human TF networks are highly cell selective and are driven by cohorts of factors that include regulators with previously unrecognized roles in control of cellular identity. Moreover, we identify many widely expressed factors that impact transcriptional regulatory networks in a cell-selective manner. Strikingly, in spite of their inherent diversity, all cell-type regulatory networks independently converge on a common architecture that closely resembles the topology of living neuronal networks. Together, our results provide an extensive description of the circuitry, dynamics, and organizing principles of the human TF regulatory network.


Figures

Figure 1
Figure 1. Construction of comprehensive transcriptional regulatory networks
(A) Schematic for construction of regulatory networks using DNaseI footprints. Transcription factor (TF) genes represent network nodes. Each TF node has regulatory inputs (TF footprints within its proximal regulatory regions), and regulatory outputs (footprints of that TF in the regulatory regions of other TF genes). Inputs and outputs comprise the regulatory network interactions ‘edges’. For example: (1) In Th1 cells, the IRF1 promoter contains DNaseI footprints matching four regulatory factors (STAT1, CNOT3, SP1 and NFKB). (2) In Th1 cells, IRF1 footprints are found upstream of many other genes (for example, GABP1, IRF7, STAT6). (3) The same process is iterated for every TF gene in that cell type, enabling compilation of a cell type network comprising nodes (TF genes) and edges (regulatory inputs and outputs of TF genes). (4) Network construction is carried out independently using DNaseI footprinting data from each of 41 cell types, resulting in 41 independently-derived cell type networks. (B and C) Comparison of well-annotated vs. de novo-derived regulatory sub-networks. (B) Muscle sub-network. Top, experimentally-defined regulatory sub-network for major factors controlling skeletal muscle differentiation and transcription. Arrows indicate direction(s) of regulatory interactions between factors. Bottom, regulatory sub-network derived de novo from the DNaseI footprint-anchored network of skeletal myoblasts closely matches the experimentally annotated network. (C) Pluripotency sub-network. Top, regulatory sub-network for major pluripotency factors defined experimentally in mouse ES cells (Kim et al. 2008). Bottom, regulatory sub-network derived de novo from human ES cells is virtually identical to the annotated network. (D,E) De novo-derived sub-networks in (B) and (C) match the annotated networks in a cellspecific fashion. Vertical axes: Jaccard index, a measure of network similarity, comparing the annotated sub-network with regulatory interactions between the four factors derived de novo from each of 41 cell types independently (horizontal axes). For the annotated muscle subnetwork, the highest similarity is seen in skeletal myoblasts, followed by differentiated skeletal muscle. By contrast, sub-networks computed from fibroblasts are largely devoid of relevant interactions. For the annotated pluripotency sub-network, the highest similarity is seen in human ES cells (H7-ESC).
Figure 2
Figure 2. Cell-specific vs. shared regulatory interactions in TF networks of 41 diverse cell types
Shown for each of 41 cell types are schematics of cell type-specific vs. non-specific (black) regulatory interactions between 475 TFs. Each half of each circular plot is divided into 475 points (not visible at this scale), one for each transcription factor. Lines connecting the left and right half-circles represent regulatory interactions between each factor and any other factors with which it interacts in the given cell type. Yellow lines represent TF-to-TF connections that are specific to the indicated cell type. Black lines represent TF-to-TF connections that are seen in two or more cell types. The order of TFs along each half-circular axis is shown in Supplementary Table 1, and represents a sorted list (descending order) of their degree (i.e., number of connections to other TFs) in the ES cell network, from highest degree on top (SP1) to lowest degree on bottom (ZNF354C). Cell-types are grouped based on their developmental and functional properties. Insert on bottom right shows a detailed view of the human ES cell network, and highlights the interactions of four pluripotent (KLF4, NANOG, POU5F1, SOX2) and four constitutive factors (SP1, CTCF, NFYA, MAX) with purple and green edges, respectively.
Figure 3
Figure 3. Transcriptional regulatory networks show marked cell-type specificity
(A) Cross-regulatory interactions between four pluripotency factors and four hematopoietic factors in regulatory networks of six diverse cell types. All eight factors are arranged in the same order along each axis. Regulatory interactions (i.e., from regulator to regulated) are shown by arrows in clock-wise orientation. Cell type-specific edges are colored as indicated, whereas regulatory interactions present in two or more cell type networks are shown in grey. (B) Cross-regulatory interactions between all 475 TFs in regulatory networks of six diverse cell types. The 475 TFs are arranged in the same order along each axis, regulatory interactions directed clockwise. Edges unique to a given cell type network are colored as indicated in the legend whereas regulatory interactions present in two or more networks are colored grey. Interactions present in all six cell type networks are colored black. (See also Supplementary Figure S1 and Supplementary Table S2).
Figure 4
Figure 4. Functionally related cell types share similar core transcriptional regulatory networks
(A) Clustering of cell type networks by normalized network degree (NND). For each of 475 TFs within a given cell type network, the relative number of edges was compared between all 41 cell-types using a Euclidean distance metric and Ward clustering. Cell types are colored based on their physiological and/or functional properties. (B) Relative degree of master regulatory TFs in cell type networks. Shown is a heatmap representing the relative normalized degree of the indicated TFs between each of the 41 cell types. For a given TF and cell type, high relative degree indicates high connectivity with other TFs in that cell type. Note that the relative degree of known regulators of cell fate such as MYOD, OCT4, or MYB is highest in their cognate cell type or lineage. Similar patterns were found for other TFs without previously recognized roles in specification of cell identiy. (See also Supplemental Figure S2).
Figure 5
Figure 5. Cell-selective behaviors of widely expressed TFs
(A) Shown are regulatory sub-networks comprising edges (arrows) between seven major hematopoietic regulators in five hematopoietic and one non-hematopoietic cell types. For each TF, the size of the corresponding colored oval is proportional to the normalized out-degree (i.e., out-going regulatory interactions) of that factor within the complete network of each cell type. The early hematopoietic fate decision factor PU.1 appears to play the largest role in hematopoietic stem cells (CD34+) and in promyelocytic leukemia (NB4) cells. The erythroidspecific regulator GATA1 appears as a strong driver of the core TAL1/PU.1/HES1/MYB network specifically within erythroid cells. In both B-cells and T-cells, the sub-network takes on a directional character, with PU.1 in a superior position. By contrast, the network is largely absent in non-hematopoietic cells (muscle, HSMM, bottom right). (B) Heatmap showing the frequency with which the retinoic acid receptor-alpha (RAR-α) is positioned as a driver (top) or passenger (middle or bottom) within feed-forward loops (FFLs) mapped in 41 cell type regulatory networks. Note that in most cell-types, RAR-α participates in feed-forward loops at ‘passenger’ positions 2 and 3. However, within blood and endothelial cells, RAR-α switches from being a passenger of FFLs to being a driver (top position) of FFLs. In acute promyelocytic leukemia cells (NB4), RAR-α acts exclusively as a potent driver of feed-forward loops. Cell types are arranged according to the clustered ordering in Figure 4.
Figure 6
Figure 6. Conserved architecture of human transcription factor regulatory networks
(A) Shown is the relative enrichment or depletion of the 13 possible three-node architectural network motifs within the regulatory networks of each cell type (red lines), compared with the relative enrichment of the same motifs in the C. elegans neuronal connectivity network. Note that the network architecture of each individual cell type closely mirrors that of the living neuronal network (average summed squared error (SSE) of only 0.0705). (B) Enrichment of each triad network motifs for a transcription factor network computed using only motif scan predictions within +/− 5kb of TF promoters (brown line). The resulting network bares little resemblance to the C. elegans network (blue line) (SSE of 2.536). (C) The relative enrichment of different triad network motifs is shown for a transcription factor regulatory network generated by pooling DNaseI footprints from all 41 tested cell types into a single archetype (orange line). The resulting topology diverges considerably from that of the neuronal network, far more so than was observed for any individual cell type (SSE of 0.4308). (DE) Network architectures are highly cell-specific (D) Overlap of feed-forward loops (FFLs) identified in three different progenitor cell types - embryonic stem cells (H7-hESC), hematopoietic stem cells (CD34+) and skeletal muscle myoblasts (HSMM). Note that most FFLs are restricted to an individual cell type. (E) Overlap of feed-forward loops (FFLs) identified in three pulmonary cell types - lung fibroblasts (NHLF), small airway epithelium (SAEC), and pulmonary lymphatic endothelium (HMVEC_LLy). Highly distinct architectures are present even among cell types from the same organ structure. (F) Overlap of FFLs from networks of neighboring cell types, following the ordering and coloration shown in Figure 4A. The size of each circle is proportional to the number of FFLs contained within the network of the corresponding cell type. The color of the intersection region between adjacent cell types indicates the Jaccard index between FFLs from those two cell types (see legend in upper right of panel F). The average number of FFLs in each network, the total number of FFLs across all networks and the number of common FFLs across all networks is indicated in the center of the graph. (See also Supplemental Figure S3 and Supplemental Table S3).

References

    1. Alon U. An Introduction to Systems Biology: Design Principles of Biological Circuits. 1 st ed. Chapman and Hall/CRC; 2006.
    1. Badis G, Berger MF, Philippakis AA, Talukder S, Gehrke AR, Jaeger SA, Chan ET, Metzler G, Vedenko A, Chen X, et al. Diversity and Complexity in DNA Recognition by Transcription Factors. Science. 2009;324:1720–1723. - PMC - PubMed
    1. Barabási A-L, Oltvai ZN. Network biology: understanding the cell’s functional organization. Nature Reviews Genetics. 2004;5:101–113. - PubMed
    1. Basso K, Margolin AA, Stolovitzky G, Klein U, Dalla-Favera R, Califano A. Reverse engineering of regulatory networks in human B cells. Nature Genetics. 2005;37:382–390. - PubMed
    1. Berger MF, Badis G, Gehrke AR, Talukder S, Philippakis AA, Peña-Castillo L, Alleyne TM, Mnaimneh S, Botvinnik OB, Chan ET, et al. Variation in Homeodomain DNA Binding Revealed by High-Resolution Analysis of Sequence Preferences. Cell. 2008;133:1266–1276. - PMC - PubMed

Publication types