. 2012 Oct;292(1-2):35-50.
doi: 10.1016/j.heares.2012.08.005. Epub 2012 Aug 24.

How are inner hair cells stimulated? Evidence for multiple mechanical drives

Affiliations

How are inner hair cells stimulated? Evidence for multiple mechanical drives

John J Guinan Jr. Hear Res. 2012 Oct.

Abstract

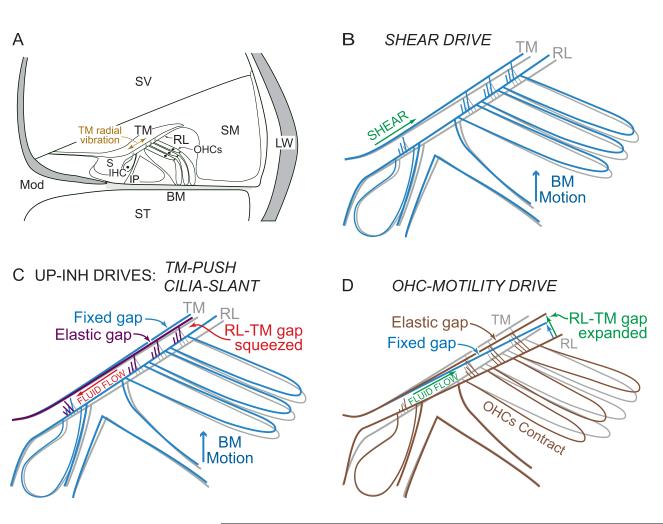
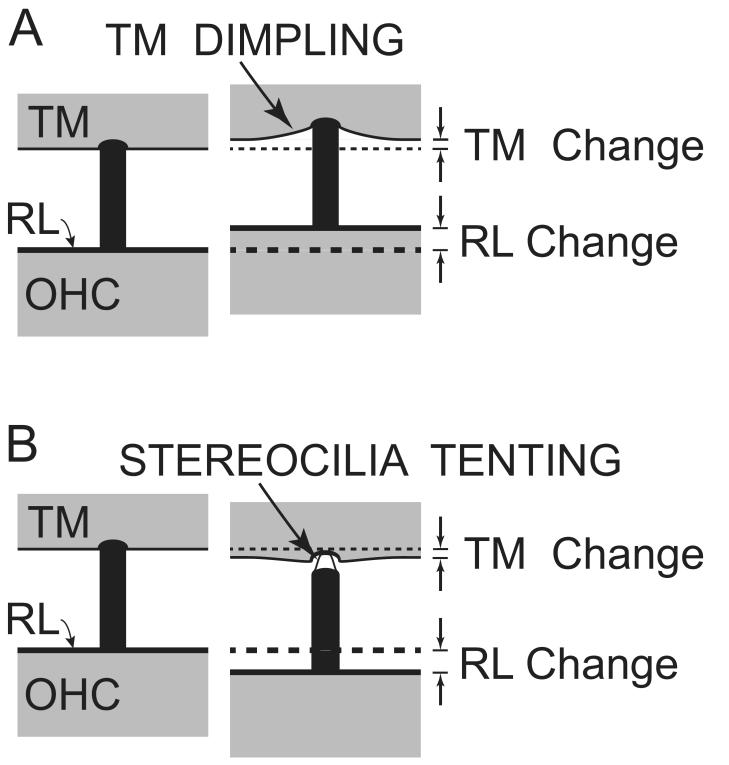
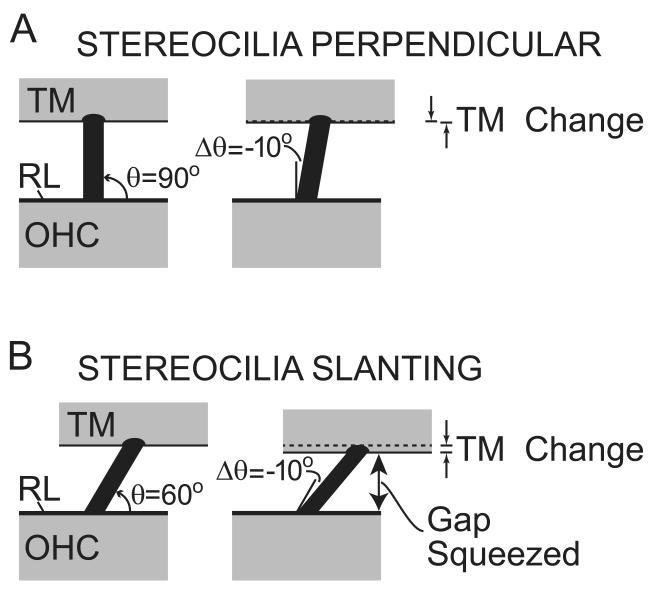
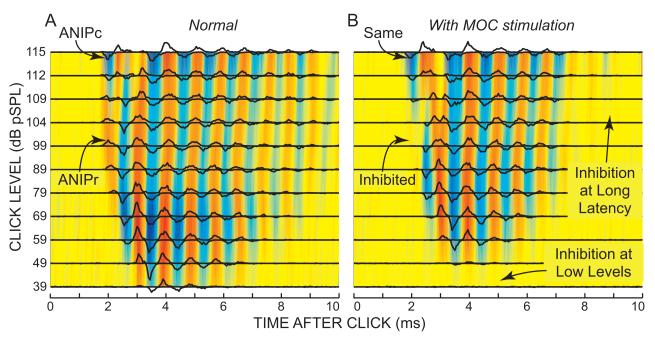
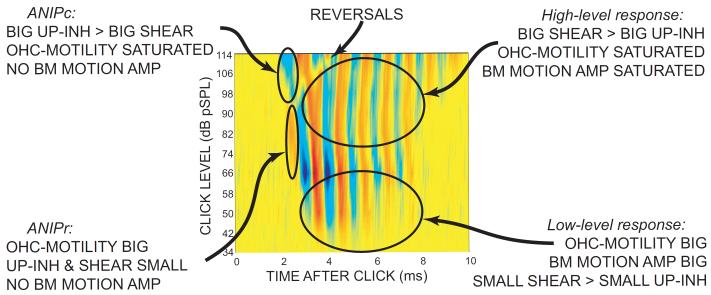
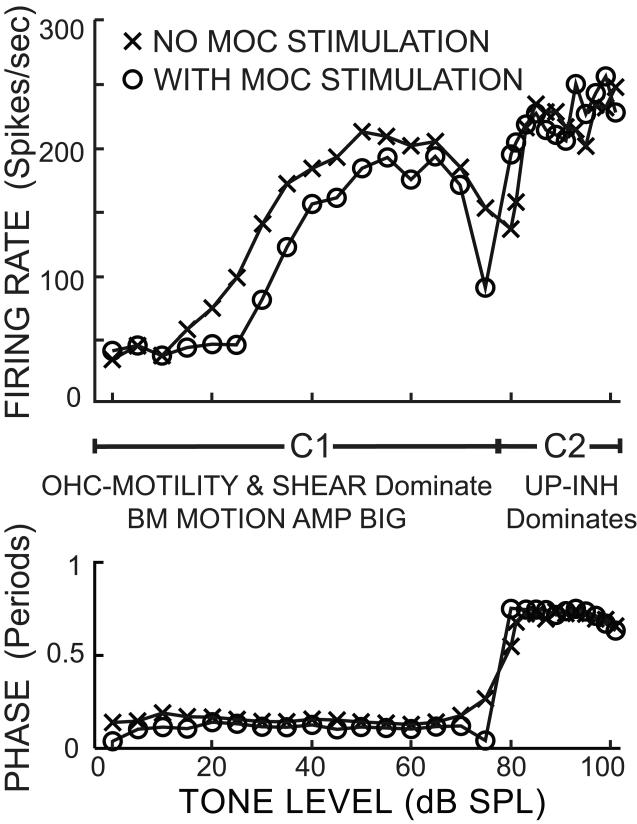
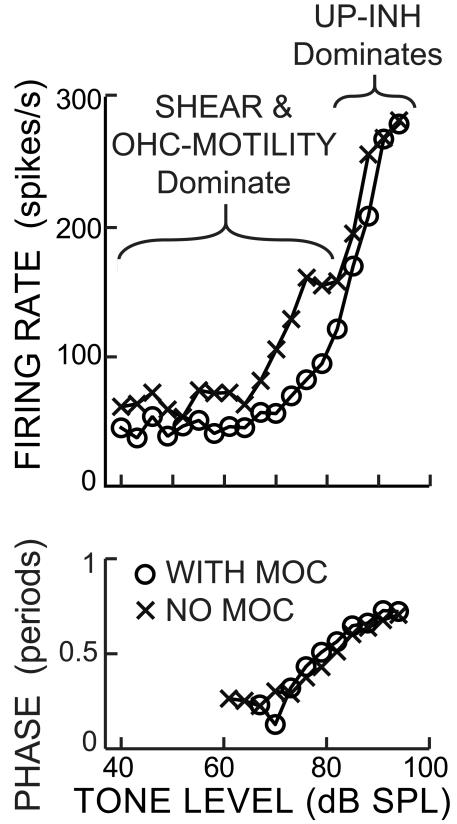
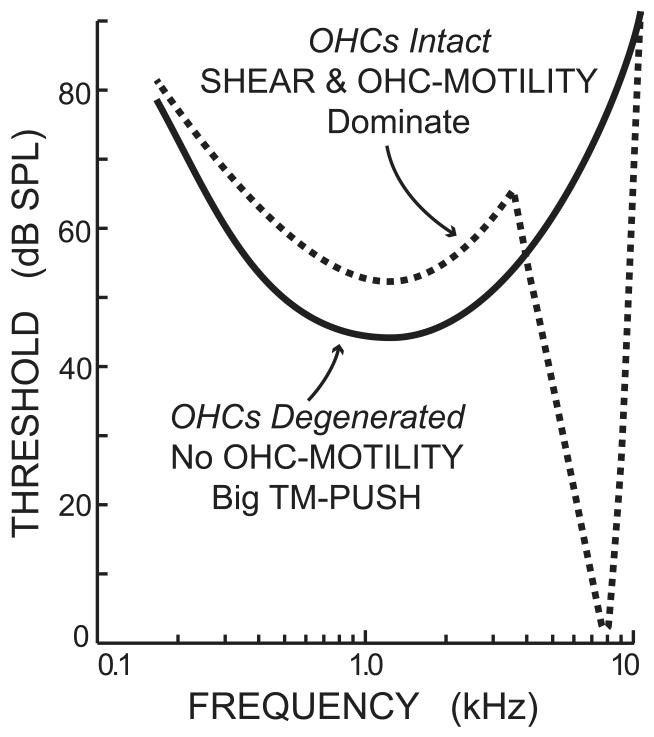
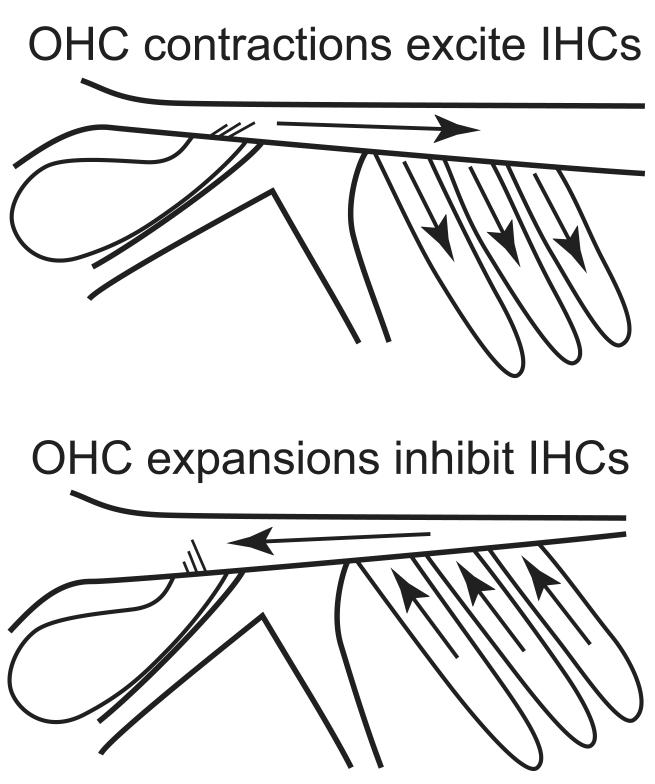
Recent studies indicate that the gap over outer hair cells (OHCs) between the reticular lamina (RL) and the tectorial membrane (TM) varies cyclically during low-frequency sounds. Variation in the RL-TM gap produces radial fluid flow in the gap that can drive inner hair cell (IHC) stereocilia. Analysis of RL-TM gap changes reveals three IHC drives in addition to classic SHEAR. For upward basilar-membrane (BM) motion, IHC stereocilia are deflected in the excitatory direction by SHEAR and OHC-MOTILITY, but in the inhibitory direction by TM-PUSH and CILIA-SLANT. Upward BM motion causes OHC somatic contraction which tilts the RL, compresses the RL-TM gap over IHCs and expands the RL-TM gap over OHCs, thereby producing an outward (away from the IHCs) radial fluid flow which is the OHC-MOTILITY drive. For upward BM motion, the force that moves the TM upward also compresses the RL-TM gap over OHCs causing inward radial flow past IHCs which is the TM-PUSH drive. Motions that produce large tilting of OHC stereocilia squeeze the supra-OHC RL-TM gap and caused inward radial flow past IHCs which is the CILIA-SLANT drive. Combinations of these drives explain: (1) the reversal at high sound levels of auditory nerve (AN) initial peak (ANIP) responses to clicks, and medial olivocochlear (MOC) inhibition of ANIP responses below, but not above, the ANIP reversal, (2) dips and phase reversals in AN responses to tones in cats and chinchillas, (3) hypersensitivity and phase reversals in tuning-curve tails after OHC ablation, and (4) MOC inhibition of tail-frequency AN responses. The OHC-MOTILITY drive provides another mechanism, in addition to BM motion amplification, that uses active processes to enhance the output of the cochlea. The ability of these IHC drives to explain previously anomalous data provides strong, although indirect, evidence that these drives are significant and presents a new view of how the cochlea works at frequencies below 3 kHz.


Figures

Figure 1
Figure 1
Outlines of the organ of Corti showing the four IHC drives. A: A cross section through the apical cochlea. B-D: Expanded views of the central part of organ of Corti showing the at-rest structures as gray. B (SHEAR): Upward movement (blue) of the basilar membrane (BM) toward scala vestibuli (SV) causes shear between the reticular lamina (RL) and the tectorial membrane (TM). Since the organ of Corti rotates about the foot of the inner pillar cells (IP), the RL movement has a significant radial component toward the modiolus (Mod). In contrast, the TM rotates about its insertion and shows little radial movement. Although the IHC-stereocilia radial shear motion is toward the modiolus, the rotational component is in the excitatory direction (Green arrow). C (UP-INH drives): (1) TM-PUSH: Upward BM movement causes TM movement by forces transmitted through the OHC stereocilia which produce less TM movement (purple) than for a fixed gap (blue). The resulting squeezing of the RL-TM gap forces fluid past IHC stereocilia in the inhibitory direction. (2) CILIA-SLANT: The decrease in the RL-TM gap over OHCs is caused by tilting fixed-length OHC stereocilia (as in Figure 3b) thereby forcing fluid past IHC stereocilia in the inhibitory direction. D (OHC-MOTILITY): OHC contractions pull the TM down through forces on the OHC stereocilia that expand the RL-TM gap over OHCs (brown) compared to a fixed gap (blue). The OHC contractions also produce rotation of the RL about the head of the pillars that squeezes the RL-TM gap over IHCs. Both of these gap changes produce fluid flow that deflects IHC stereocilia in the excitatory direction. The rotations of contracted OHC cell bodies are patterned after results of Karavitaki and Mountain (2007b). IHC=inner hair cell, OHCs=outer hair cells, S=inner sulcus, ST=scala tympani, SM=scala media, LW=lateral wall.
Figure 2
Figure 2
Two ways (in addition to elasticity in the stereocilia themselves) in which movement of the reticular lamina (RL) over outer hair cells (OHCs) may give rise to less movement of the tectorial membrane (TM). A: TM dimpling, B: Stereocilia Tenting. Left: RL and TM in the rest condition. Right: Hypothesized TM position changes from an upward RL change (A) or a downward RL change (B).
Figure 3
Figure 3
Stereocilia deflections produce a change in the RL-TM gap if the stereocilia are not perpendicular to the RL and TM. Left: RL and TM positions at rest. Right: RL and TM positions for a 10° decrease in stereocilia angle. θ is the angle between the stereocilia and the RL at rest and Δθ is the change in angle from the rest position.
Figure 4
Figure 4
Click response patterns with (B) and without (A) medial olivocochlear (MOC) efferent stimulation. In each panel, lines show compound post-stimulus time (cPST) histograms from click level series, stacked vertically and superimposed on color-coded, interpolated plots of the cPST data. ANIP = auditory nerve initial peak. ANIPr = ANIP from rarefaction clicks. ANIPc = ANIP from condensation clicks. Red = response to rarefaction clicks; blue = response to condensation clicks; yellow = no response. Fiber characteristic frequency = 1168 Hz, spontaneous rate = 16 s/s. Note that the steps between click levels were smaller at high levels. Cat data obtained by Guinan et al. (2005).
Figure 5
Figure 5
Color-coded cPST histograms as in Fig. 4 from click responses showing reversals that occur at higher levels for later peaks. Labels indicate the relative dominance of the IHC drives and the state of the BM motion amplifier. In ANIPc, the UP-INH drive is largely TM-PUSH rather than CILIA-SLANT. Cat data obtained by Lin and Guinan (2000).
Figure 6
Figure 6
Rate and phase as a function of sound level for a single auditory-nerve fiber with and without MOC stimulation. The response below the phase reversal is termed component 1 (C1) and that above the phase reversal component 2 (C2). Below the reversal, OHC-MOTILITY and SHEAR drives dominate the IHC response and there is BM motion amplification. Stimulating MOC efferents reduces the response by reducing OHC-MOTILITY and BM motion amplification. Above the reversal, UP-INH drives dominate the response and these are not changed by MOC stimulation. Tone = 0.7 kHz, CF = 0.64 kHz. Cat data obtained by Gifford and Guinan (1983).
Figure 7
Figure 7
Stylized tuning curves illustrating the effect of total OHC loss created either by acoustic trauma or treatment with kanamycin. The “OHCs Intact” curve is an estimate of the tuning curve before the pathology, based on tuning curves from the position along the cochlea of the labeled “OHCs degenerated” fiber. With OHCs degenerated, the tuning-curve tail is hypersensitive and has a reversed phase because the lack of OHC stereocilia greatly increases TM-PUSH which is an UP-INH drive. Drawings based on Kiang et al. (1986).
Figure 8
Figure 8
MOC inhibition of an AN fiber response as a function of tone level at a tail frequency. Near threshold, SHEAR and OHC-MOTILITY drives dominate the response and the OHC-MOTILITY drive is inhibited by MOC stimulation. At high levels, UP-INH drives dominate. The phase makes a slow transition as UP-INH slowly grows to dominate the response. Tone frequency = 2.0 kHz, fiber CF = 17.78 kHz, SR = 69.4 spikes/s. Cat data obtained by Stankovic and Guinan (1999, 2000).
Figure 9
Figure 9
Cartoon showing how the OHC-MOTILITY drive enhances cochlear output by moving fluid back and forth radially within the RL-TM gap.

References

    1. Allen JB. Cochlear micromechanics--a physical model of transduction. J Acoust Soc Am. 1980;68:1660–70. - PubMed
    1. Baumgart J, Chiaradia C, Fleischer M, Yarin Y, Grundmann R, Gummer AW. Fluid mechanics in the subtectorial space. In: Cooper NP, Kemp DT, editors. Concepts and Challenges in the Biophysics of Hearing. World Scientific; Singapore: 2009. pp. 288–293.
    1. Chadwick RS, Dimitriadis EK, Iwasa KH. Active control of waves in a cochlear model with subpartitions. P.N.A.S. 1996;93:2564–9. - PMC - PubMed
    1. Chan DK, Hudspeth AJ. Mechanical responses of the organ of corti to acoustic and electrical stimulation in vitro. Biophys J. 2005;89:4382–95. - PMC - PubMed
    1. Cheatham MA, Dallos P. The level dependence of response phase: observations from cochlear hair cells. J Acoust Soc Am. 1998;104:356–69. - PubMed

Publication types