. 2012 Dec;100(6):337-44.
doi: 10.1016/j.ygeno.2012.08.003. Epub 2012 Aug 19.

A single-sample microarray normalization method to facilitate personalized-medicine workflows

Affiliations

A single-sample microarray normalization method to facilitate personalized-medicine workflows

Stephen R Piccolo et al. Genomics. 2012 Dec.

Abstract

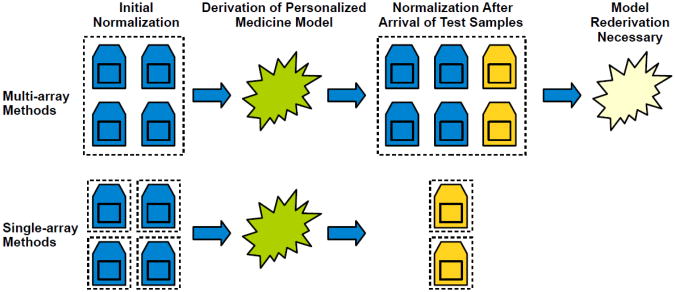
Gene-expression microarrays allow researchers to characterize biological phenomena in a high-throughput fashion but are subject to technological biases and inevitable variabilities that arise during sample collection and processing. Normalization techniques aim to correct such biases. Most existing methods require multiple samples to be processed in aggregate; consequently, each sample's output is influenced by other samples processed jointly. However, in personalized-medicine workflows, samples may arrive serially, so renormalizing all samples upon each new arrival would be impractical. We have developed Single Channel Array Normalization (SCAN), a single-sample technique that models the effects of probe-nucleotide composition on fluorescence intensity and corrects for such effects, dramatically increasing the signal-to-noise ratio within individual samples while decreasing variation across samples. In various benchmark comparisons, we show that SCAN performs as well as or better than competing methods yet has no dependence on external reference samples and can be applied to any single-channel microarray platform.


Figures

Figure 1
Figure 1
Multi-array versus single-array normalization. A) With multi-array methods, such as RMA, samples are processed in groups. Thus when new samples have been hybridized—for example, in personalized-medicine settings—all samples, old and new, may need to be renormalized as a group, which may require reanalysis of the data or recalibration of biomarkers. Contrarily, with single-array methods, including SCAN, each sample is normalized individually. Thus newly arrived samples remain separate during normalization, and data values for existing samples do not change. B) Affymetrix offers many different array versions to quantify human gene expression. SCAN can normalize any version. However, fRMA does not currently support most array versions because an inadequate number and diversity of previously hybridized samples have been made available publicly. And because MAS5 relies on mismatch probes, it is unable to normalize samples from newer array versions.
Figure 1
Figure 1
Multi-array versus single-array normalization. A) With multi-array methods, such as RMA, samples are processed in groups. Thus when new samples have been hybridized—for example, in personalized-medicine settings—all samples, old and new, may need to be renormalized as a group, which may require reanalysis of the data or recalibration of biomarkers. Contrarily, with single-array methods, including SCAN, each sample is normalized individually. Thus newly arrived samples remain separate during normalization, and data values for existing samples do not change. B) Affymetrix offers many different array versions to quantify human gene expression. SCAN can normalize any version. However, fRMA does not currently support most array versions because an inadequate number and diversity of previously hybridized samples have been made available publicly. And because MAS5 relies on mismatch probes, it is unable to normalize samples from newer array versions.
Figure 2
Figure 2
Proportion GC content versus probe intensity. A) For an Affymetrix Human Exon ST 1.0 array (GSE25219), this figure illustrates the relationship between probe-level GC content and expression intensities. B) As GC content increases, raw intensity also tends to increase. However, after SCAN processing, this bias is removed.
Figure 2
Figure 2
Proportion GC content versus probe intensity. A) For an Affymetrix Human Exon ST 1.0 array (GSE25219), this figure illustrates the relationship between probe-level GC content and expression intensities. B) As GC content increases, raw intensity also tends to increase. However, after SCAN processing, this bias is removed.
Figure 3
Figure 3
SCAN adjusts for sample-level variations in expression intensity arising from platform and batch effects. In A), log2 intensity values are shown for CMAP samples treated with valproic acid. In B), SCAN normalized values are shown for the same samples. Before normalization, value ranges varied largely by batch and/or platform (each color represents a distinct batch of samples profiled on a specific Affymetrix platform). After normalization, values fell within a similar range, irrespective of batch or platform.
Figure 3
Figure 3
SCAN adjusts for sample-level variations in expression intensity arising from platform and batch effects. In A), log2 intensity values are shown for CMAP samples treated with valproic acid. In B), SCAN normalized values are shown for the same samples. Before normalization, value ranges varied largely by batch and/or platform (each color represents a distinct batch of samples profiled on a specific Affymetrix platform). After normalization, values fell within a similar range, irrespective of batch or platform.
Figure 4
Figure 4
Correlation of sample-wise expression levels between CCLE and GSK cell lines. CCLE and GSK data were processed using each normalization method, and sample-wise Pearson correlation coefficents were calculated. Across the samples, SCAN values were more highly correlated than for the other normalization methods, suggesting its ability to produce consistent output values for analogous samples processed in independent facilities by different personnel at different times. (Correlation coefficients were sorted for each normalization method independently before plotting.)
Figure 5
Figure 5
Comparison of RAS pathway activation probabilities for CCLE and GSK cell line data. The probability of RAS pathway activation was estimated for individual samples in CCLE and GSK cell lines. For each normalization method, a pathway signature was derived through a comparison of expression levels in RAS-activated cell cultures and controls. The signatures were then projected onto the cell line data, and a probability of pathway activation was calculated. For SCAN and fRMA (A and B), probabilities were highly concordant across the data sets, whereas for RAS and MAS5 (C) and D) the probabilities were less concordant and fell within narrower ranges. Lack of replication between data sets may lead to markedly different biological conclusions, depending on which data set is examined.
Figure 5
Figure 5
Comparison of RAS pathway activation probabilities for CCLE and GSK cell line data. The probability of RAS pathway activation was estimated for individual samples in CCLE and GSK cell lines. For each normalization method, a pathway signature was derived through a comparison of expression levels in RAS-activated cell cultures and controls. The signatures were then projected onto the cell line data, and a probability of pathway activation was calculated. For SCAN and fRMA (A and B), probabilities were highly concordant across the data sets, whereas for RAS and MAS5 (C) and D) the probabilities were less concordant and fell within narrower ranges. Lack of replication between data sets may lead to markedly different biological conclusions, depending on which data set is examined.

References

    1. van 't Veer LJ, Dai H, van de Vijver MJ, He YD, Hart AAM, Mao M, Peterse HL, van der Kooy K, Marton MJ, Witteveen AT, Schreiber GJ, Kerkhoven RM, Roberts C, Linsley PS, Bernards R, Friend SH. Gene expression profiling predicts clinical outcome of breast cancer. Nature. 2002;415:530–6. - PubMed
    1. Paik S, Shak S, Tang G, Kim C, Baker J, Cronin M, Baehner FL, Walker MG, Watson D, Park T, Hiller W, Fisher ER, Wickerham DL, Bryant J, Wolmark N. A multigene assay to predict recurrence of tamoxifen-treated, node-negative breast cancer. N Engl J Med. 2004;351:2817–26. - PubMed
    1. McDermott U, Downing JR, Stratton MR. Genomics and the continuum of cancer care. N Engl J Med. 2011;364:340–50. - PubMed
    1. Lo SS, Mumby PB, Norton J, Rychlik K, Smerage J, Kash J, Chew HK, Gaynor ER, Hayes DF, Epstein A, Albain KS. Prospective multicenter study of the impact of the 21-gene recurrence score assay on medical oncologist and patient adjuvant breast cancer treatment selection. J Clin Oncol. 2010;28:1671–6. - PubMed
    1. Irizarry RA, Bolstad BM, Collin F, Cope LM, Hobbs B, Speed TP. Summaries of Affymetrix GeneChip probe level data. Nucleic Acids Res. 2003;31:e15. - PMC - PubMed

Publication types

LinkOut - more resources