. 2012 Sep 21;37(3):501-10.
doi: 10.1016/j.immuni.2012.05.031. Epub 2012 Sep 6.

T-bet(+) Treg cells undergo abortive Th1 cell differentiation due to impaired expression of IL-12 receptor β2

Affiliations

T-bet(+) Treg cells undergo abortive Th1 cell differentiation due to impaired expression of IL-12 receptor β2

Meghan A Koch et al. Immunity. .

Abstract

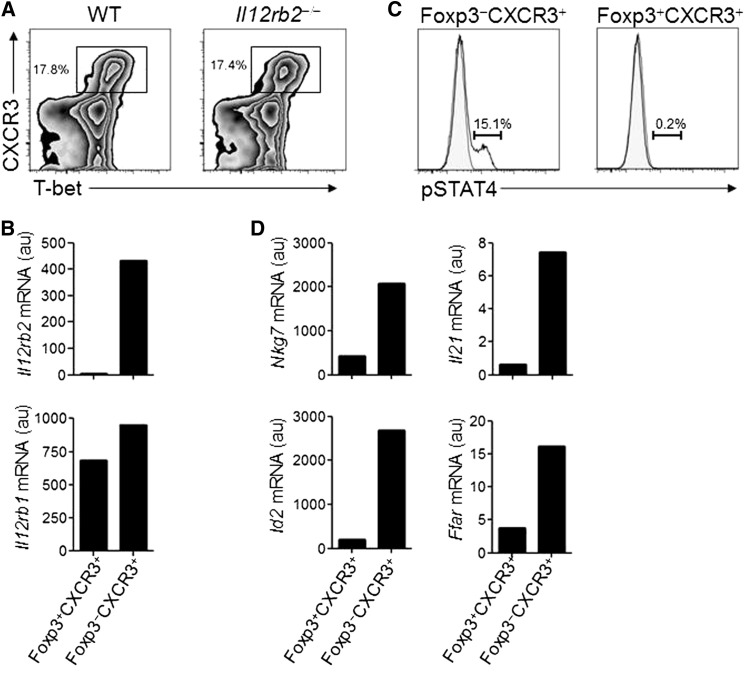
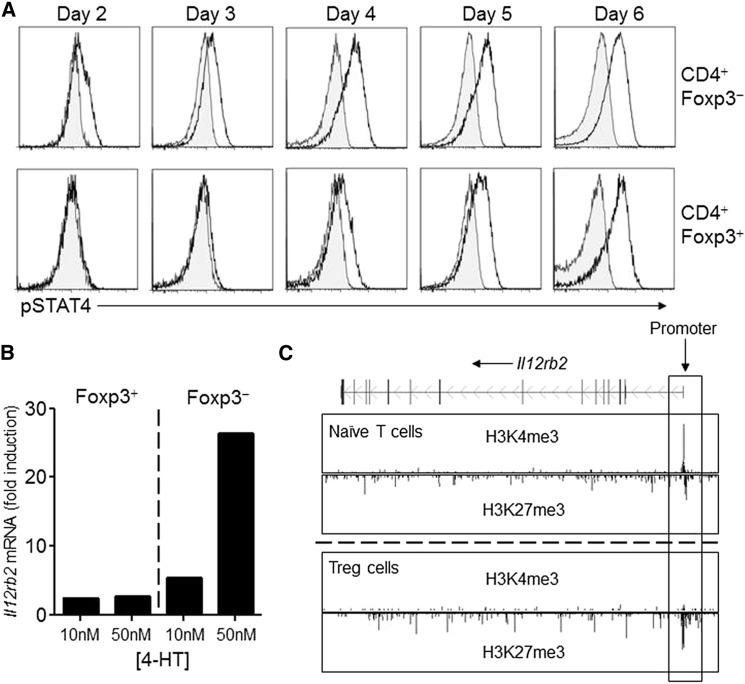
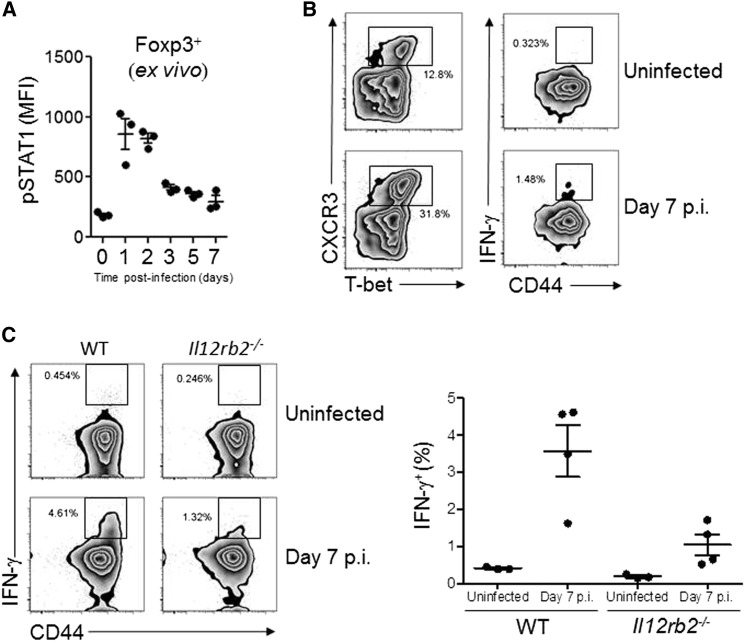
Foxp3(+) regulatory T (Treg) cells limit inflammatory responses and maintain immune homeostasis. Although comprised of several phenotypically and functionally distinct subsets, the differentiation of specialized Treg cell populations within the periphery is poorly characterized. We demonstrate that the development of T-bet(+) Treg cells that potently inhibit T helper 1 (Th1) cell responses was dependent on the transcription factor STAT1 and occurred directly in response to interferon-γ produced by effector T cells. Additionally, delayed induction of the IL-12Rβ2 receptor component after STAT1 activation helped ensure that Treg cells do not readily complete STAT4-dependent Th1 cell development and lose their ability to suppress effector T cell proliferation. Thus, we define a pathway of abortive Th1 cell development that results in the specialization of peripheral Treg cells and demonstrate that impaired expression of a single cytokine receptor helps maintain Treg cell-suppressive function in the context of inflammatory Th1 cell responses.


Figures

None
Graphical abstract
Figure 1
Figure 1
STAT1- and IFN-γR-Dependent Expression of T-bet by Treg Cells (A) Flow cytometric analysis of T-bet expression by CD4+Foxp3+ Treg cells stimulated with anti-CD3/anti-CD28 in media containing IL-2 alone (shaded histograms) or IL-2 + IFN-γ or IL-27 (open histograms) for 5 days as indicated. (B) Flow cytometric analysis of CXCR3 and T-bet expression by gated wild-type- or Stat1−/−-derived CD4+Foxp3+ splenocytes in mixed bone marrow chimeras. Data are representative of two independent experiments with at least three mice analyzed per experiment. Graph depicts the frequency of CXCR3+T-bet+ cells among total WT and Stat1−/−-derived CD4+Foxp3+ splenic Treg cells in each BM chimera examined. Linked points represent the values from individual chimeric mice. (C) Flow cytometric analysis of CXCR3 expression by gated wild-type- or Ifngr1−/−-derived CD4+Foxp3+ Treg cells in the brains of mixed bone marrow chimeras 14 days after induction of EAE. (D) Flow cytometric analysis of CD44 and IL-10 expression by CD4+Foxp3+ Treg cells from either wild-type or Ifngr1−/− donors in the brains of mixed bone marrow chimeras 19 days after induction of EAE. Graphs in (C) and (D) depict the frequency of CXCR3+ or IL-10+ cells among the wild-type or Ifngr1−/− Treg cells in each chimera examined. Linked points represent the values from individual chimeric mice.
Figure 2
Figure 2
T Cell-Derived IFN-γ Induces T-bet Expression by Treg Cells (A) Representative flow cytometric analysis of CXCR3 and T-bet expression by CD4+Foxp3+ cells isolated from the spleens of mixed bone marrow chimeras containing T cells derived from WT (left) or Ifng−/− (right) donors. The graph shows the frequency of CXCR3+ T-bet+ cells among total CD4+ Foxp3+ (Treg) cells isolated from the spleens, peripheral lymph nodes (PLN), and peritoneal exudate cells (PEC) of the indicated chimeras. Each point represents an individual mouse. Data are representative of two independent experiments. Error bars denote SEM. (B) Representative flow cytometric analysis of CXCR3 and T-bet expression by gated CD4+Foxp3+ cells isolated from the spleens of wild-type (top panels) and Ifng−/− (bottom panels) mice immunized twice with OVAp after transfer of Th1 polarized OVA-specific CD4+ T cells (right panels) or without transfer (left panels). Numbers depict the proportion of cells positive for CXCR3 and T-bet. Data are representative of three independent experiments.
Figure 3
Figure 3
Treg Cells Do Not Express Il12rb2 or Respond to IL-12 Ex Vivo (A) Flow cytometric analysis of CXCR3 and T-bet expression by gated CD4+Foxp3+ splenocytes isolated from age-matched wild-type and Il12rb2−/− mice. (B) Representative qPCR analysis of Il12rb2 and Il12rb1 mRNA expression by sorted Foxp3+CXCR3+ or Foxp3CXCR3+ CD4+ splenocytes isolated from Foxp3gfp mice. (C) Representative flow cytometric analysis of STAT4 phosphorylation by sorted Foxp3+CXCR3+ or Foxp3CXCR3+ CD4+ splenocytes treated for 30 min with (open histograms) or without (shaded histograms) 25 mg/ml rmIL-12. (D) Representative qPCR analysis of expression the STAT4 regulated genes Nkg7, Id2, Il21, and Ffar by sorted Foxp3+CXCR3+ or Foxp3CXCR3+ CD4+ splenocytes isolated from Foxp3gfp mice. Data in all panels are representative of at least two independent experiments.
Figure 4
Figure 4
Differential Regulation of Il12rb2 in Foxp3+ and Foxp3 T Cells (A) Flow cytometric analysis of STAT4 phosphorylation by CD4+Foxp3 (top) or CD4+Foxp3+ (bottom) cells isolated at the indicated time points after activation in the presence of IFN-γ and treated for 30 min with (open histograms) or without (shaded histograms) 25 mg/ml rmIL-12. Data are representative of three independent experiments. (B) qPCR analysis of Il12rb2 mRNA expression by CD4+Foxp3+ and CD4+Foxp3 cells isolated from Tbx21−/−Foxp3gfp mice, infected with the T-bet-ER encoding retroviruses, and cultured for 3 days with the indicated doses of 4-HT. Data are presented as fold induction of mRNA expression over infected cells not given 4-HT and are representative of two independent experiments. (C) Distribution of H3K4me3 and H3K27me3 histone modifications along the Il12rb2 locus in the indicated CD4+ T cell subsets. ChIP-Seq data (Wei et al., 2009) was mapped to the Feb. 2006 (NCBI36/mm8) mouse genome assembly with the UCSC genome browser. Annotation of the Il12rb2 locus appears above, and the peaks represent the density of sequence tags assigned to each chromosomal region. The region surrounding the proximal promoter and exon 1 of Il12rb2 is boxed.
Figure 5
Figure 5
IL-12 Can Functionally Reprogram Treg Cells (A) Flow cytometric analysis of CD4 and IFN-γ expression by gated CD4+Foxp3+ (left) or Foxp3 (right) cells after stimulation with PMA and ionomycin. Prior to analysis, sorted Foxp3+ and Foxp3 naive phenotype cells were activated and cultured for 6 days in the presence of IL-2 and IFN-γ, after which they were washed and incubated for 3 days in media containing IL-2 with or without IL-12, as indicated. (B) Flow cytometric analysis of CFSE dilution by labeled CD4+CD25 effector T cells activated in the presence of the indicated cellular ratios of CD4+Foxp3+ Treg cells sorted from Foxp3gfp mice activated in the presence of IFN-γ and/or IL-12 as described in (A). Proliferation of effector T cells in the absence of Treg cells is displayed in the dashed histrogram overlay in the upper-left panel. Data are representative of three independent experiments.
Figure 6
Figure 6
Treg Cells Do Not Phosphorylate STAT4 during Acute L. monocytogenes Infection (A) qPCR analysis of Il12a expression in total spleen of mice at the indicated times during acute L. monocytogenes infection. The mean and SEM of measurements from three different animals at each time point are presented. (B) Representative flow cytometric analysis of pSTAT4 and IFN-γ expression by gated effector (top) and regulatory (bottom) splenic CD4+ T cells at the indicated times during L. monocytogenes infection. Analyses were performed directly ex vivo (without any in vitro restimulation) by isolating cells directly into Fix and Perm buffer. (C) Graphs depicting the percentage of pSTAT4+ cells among gated CD4+Foxp3CD44hi effector T cells (left) or CD4+Foxp3+ Treg cells (middle and right) from the spleens of individual mice analyzed either directly ex vivo (left and middle) or after IL-12 stimulation in vitro (right) at the indicated times during acute L. monocytogenes infection. Error bars in all panels denote SEM.
Figure 7
Figure 7
Treg Cells Undergo Abortive Th1 Differentiation during Acute L. monocytogenes Infection (A) A graph depicting the mean fluorescence intensity of pSTAT1 in gated CD4+Foxp3+ Treg cells from the spleens of individual mice analyzed directly ex vivo at the indicated times during acute L. monocytogenes infection. (B) Representative flow cytometric analysis of T-bet and CXCR3 (left) or CD44 and IFN-γ (right) expression by gated CD4+Foxp3+ splenic Treg cells from either uninfected mice or at day 7 after L. monocytogenes infection. (C) Representative flow cytometric analysis (left) of CD44 and IFN-γ expression by gated wild-type and Il12rb2−/− Treg cells from TCRb−/−TCRd−/− mice reconstituted with a 1:1 mixture of wild-type and Il12rb2−/− splenocytes 10 days prior to infection with L. monocytogenes. The graph (right) depicts the frequency of IFN-γ+ cells among total WT and Il12rb2−/−-derived CD4 +Foxp3 + splenic Treg cells in each animal examined. Error bars in all panels denote SEM.

Comment in

References

    1. Afkarian M., Sedy J.R., Yang J., Jacobson N.G., Cereb N., Yang S.Y., Murphy T.L., Murphy K.M. T-bet is a STAT1-induced regulator of IL-12R expression in naïve CD4+ T cells. Nat. Immunol. 2002;3:549–557. - PubMed
    1. Becskei A., Grusby M.J. Contribution of IL-12R mediated feedback loop to Th1 cell differentiation. FEBS Lett. 2007;581:5199–5206. - PMC - PubMed
    1. Bernstein B.E., Mikkelsen T.S., Xie X., Kamal M., Huebert D.J., Cuff J., Fry B., Meissner A., Wernig M., Plath K. A bivalent chromatin structure marks key developmental genes in embryonic stem cells. Cell. 2006;125:315–326. - PubMed
    1. Campbell D.J., Koch M.A. Phenotypical and functional specialization of FOXP3+ regulatory T cells. Nat. Rev. Immunol. 2011;11:119–130. - PMC - PubMed
    1. Chaudhry A., Rudra D., Treuting P., Samstein R.M., Liang Y., Kas A., Rudensky A.Y. CD4+ Regulatory T Cells Control TH17 Responses in a Stat3-Dependent Manner. Science. 2009;326:986–991. - PMC - PubMed

Publication types

MeSH terms