. 2013 Jan 1:64:91-103.
doi: 10.1016/j.neuroimage.2012.08.064. Epub 2012 Aug 30.

Spatiotemporal characteristics and vascular sources of neural-specific and -nonspecific fMRI signals at submillimeter columnar resolution

Affiliations

Spatiotemporal characteristics and vascular sources of neural-specific and -nonspecific fMRI signals at submillimeter columnar resolution

Chan Hong Moon et al. Neuroimage. .

Abstract

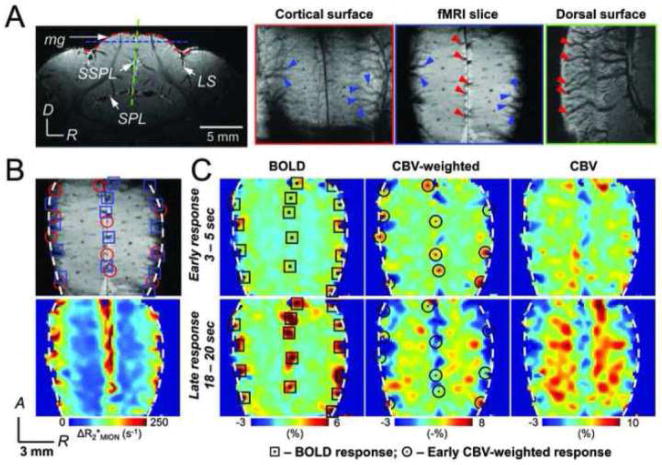
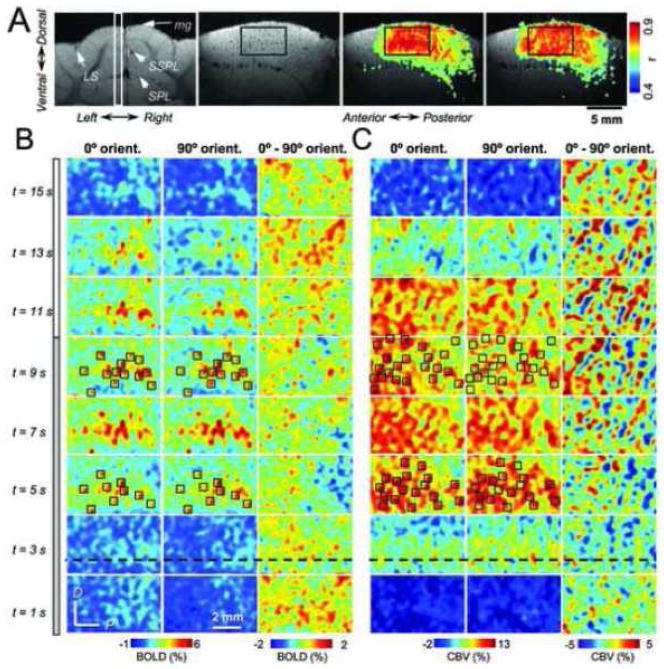
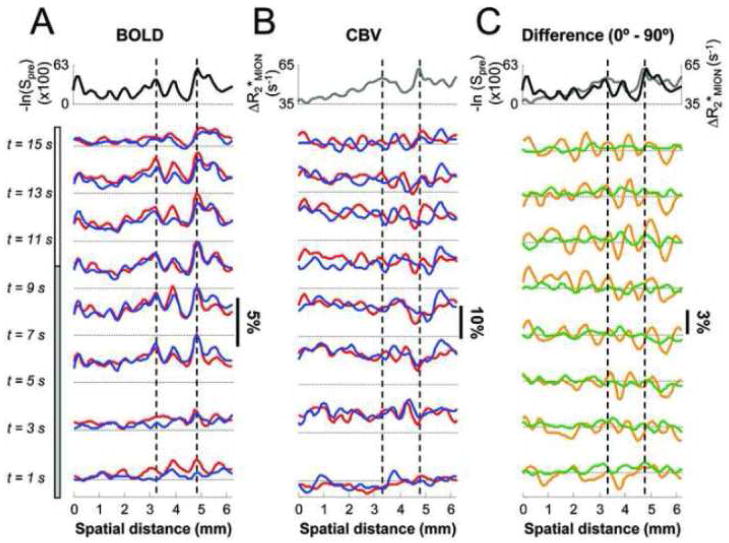
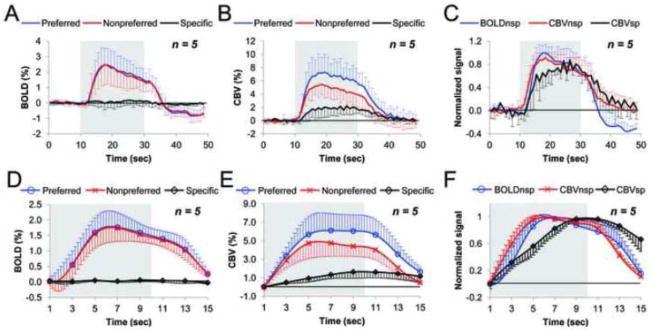
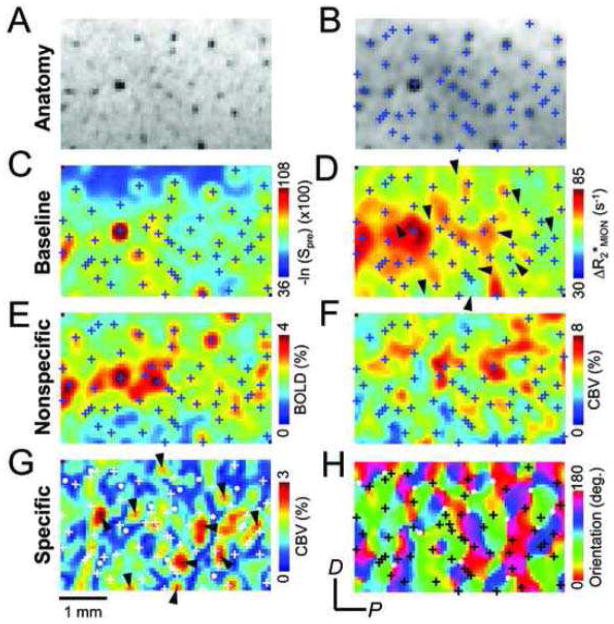
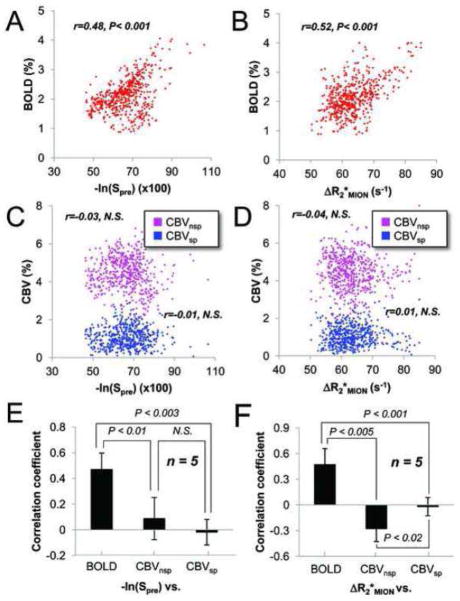
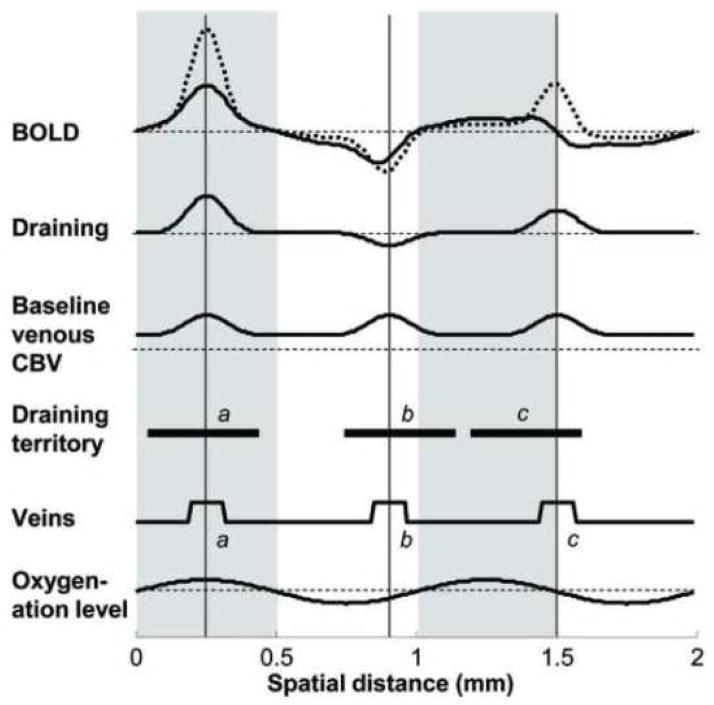
The neural specificity of hemodynamic-based functional magnetic resonance imaging (fMRI) signals is dependent on both the vascular regulation and the sensitivity of the applied fMRI technique to different types and sizes of blood vessels. In order to examine the specificity of MRI-detectable hemodynamic responses, submillimeter blood oxygenation level-dependent (BOLD) and cerebral blood volume (CBV) fMRI studies were performed in a well-established cat orientation column model at 9.4 T. Neural-nonspecific and -specific signals were separated by comparing the fMRI responses of orthogonal orientation stimuli. The BOLD response was dominantly neural-nonspecific, mostly originating from pial and intracortical emerging veins, and thus was highly correlated with baseline blood volume. Uneven baseline CBV may displace or distort small functional domains in high-resolution BOLD maps. The CBV response in the parenchyma exhibited dual spatiotemporal characteristics, a fast and early neural-nonspecific response (with 4.3-s time constant) and a slightly slower and delayed neural-specific response (with 9.4-s time constant). The nonspecific CBV signal originates from early-responding arteries and arterioles, while the specific CBV response, which is not correlated with baseline blood volume, arises from late-responding microvessels including small pre-capillary arterioles and capillaries. Our data indicate that although the neural specificity of CBV fMRI signals is dependent on stimulation duration, high-resolution functional maps can be obtained from steady-state CBV studies.


Figures

Figure 1
Figure 1
Pial vs. parenchymal activations in low-resolution fMRI. A, Vasculature on the cortical surface. (Left most) T2*-weighted anatomical image in coronal view. Curve and dotted straight lines are the positions of reconstructed images shown in 2nd to 4th panel; the red curve follows the cortical surface of marginal gyrus (corresponding to 2nd panel image), the horizontal blue line is the position of the functional imaging slice (corresponding to 3rd panel image), and the almost-vertical green line is the position of the midline sagittal image (corresponding to 4th panel). Large pial vessels running across the cortical surface (blue arrowheads in 2nd panel) or midline (red arrowheads in 4th panel) were identified, and marked on the fMRI slice (3rd panel). B, T2*-weighted anatomical image (top) and the baseline blood volume map (bottom) of the functional imaging slice. Hypointense pixels in the T2*-weighted image have large baseline blood volume (red pixels in ΔR2MION). White-dashed lines represent the surface boundary of the cortex. C, Single-condition maps of BOLD, CBV-weighted, and relative CBV at 3 – 5 s (top panels) and 18 – 20 s (bottom panels) after stimulus onset. Black/red circles (⊙) and black/blue rectangles (⊡) are the foci in CBV-weighted maps at early response time and BOLD activation maps, respectively, and are overlaid on images A and B. Note that the hot foci of CBV-weighted and BOLD maps do not coincide with each other. Patchy functional structures were observed within the cortex at early and late relative CBV maps. Abbreviations: LS, lateral sulcus; SPL, suprasplenial sulcus; SSPL, secondary suprasplenial sulcus; mg, marginal gyrus; D, dorsal; R, right; A, anterior. Same abbreviations are used in the following figures.
Figure 2
Figure 2
Spatiotemporal changes of high-resolution BOLD and CBV maps. A, Imaging slice and ROI selection. (1st panel) Axial view image of cat visual cortex reconstructed from 3-D venogram. A functional imaging slice (white rectangle) is positioned perpendicular to the axial plane to cover the medial bank of the visual cortex. (2nd panel) T2*-weighted image at the functional imaging position. (3rd and 4th panels) BOLD and CBV-weighted cross-correlation activation maps. Analysis ROI (black rectangle) is placed on a common active area in BOLD and CBV-weighted maps. B and C, Spatiotemporal changes of BOLD and CBV activation in the analysis ROI. (1st to 3rd column panels) Single-condition 0° and 90° activation maps, and differential maps between 0° and 90° stimulus at every 2 s. To assist comparison, open squares (□) are placed on strong activation regions in 0° single-condition maps at 5 s and 9 s, and overlaid on 90° single-condition maps. Note that while the sites of high BOLD signals to 0° stimulus coincide with those to 90° stimulus over stimulation period, the sites of high CBV signals to 0° and 90° stimulus coincide at early stimulation time, but are separated at late and even post-stimulation time points. Stimulation time from the onset is presented in the left of the figure; a gray bar for stimulation period (10 s) and white for resting (6 s). Supplementary to this figure, Supplementary Fig. 1 is shown with the full range of color scale for each image to maximize the contrast of activation patterns.
Figure 3
Figure 3
Temporal changes of high-resolution BOLD and CBV activation profiles. The data were obtained along the black-dashed lines shown in Figures 2B and C. A and B, Profiles of single-condition BOLD and CBV activation. Baseline blood volume profiles before and after MION injection (i.e., −ln (Spre)) and ΔR2MION) are presented in the top panels (black and gray traces). Red and blue traces represent the responses to 0° and 90° stimuli, respectively. C, Profiles of differential BOLD (green traces) and CBV activations (orange traces). A black-dotted horizontal line indicates 0% functional changes at each time point. Stimulation time from the onset is presented in the left of the figure; a gray bar for stimulation period (10 s) and white for resting (6 s). Vertical broken lines indicate a representative large vessel position.
Figure 4
Figure 4
Time courses of orientation-specific and -nonspecific fMRI signals. A and B, BOLD and CBV responses to 20-s long stimulation. D and E, BOLD and CBV responses to 10-s long stimulation. Specific response (black trace) is obtained by subtraction of the nonpreferred response (red trace) from the preferred response (blue trace). C and F, Temporal dynamics of the normalized nonspecific (i.e., nonpreferred) responses for 20-s and 10-s long stimulation periods. Functional responses in each cat were normalized to their peak signals before averaging. Note that specific CBV response is slower than nonspecific CBV and BOLD responses and is sustained even after the cessation of stimulation. BOLDnsp, CBVnsp and CBVsp stand for the orientation-nonspecific BOLD, -nonspecific CBV and -specific CBV signal, respectively. Experimental data in D – F were acquired every 2 s (×, ○, ◇ symbols) and interpolated with the B-spline method. Error bars are SD of mean (n = 5 cats). The gray bars indicate a stimulation period.
Figure 5
Figure 5
Relationships between fMRI activation and vasculature. A and B, Original and filtered T2*-weighted GE anatomy image. Local minima of image intensity are determined from B and overlaid on C through H (blue/black/white crosses). C and D, Baseline venous blood volume index, −ln (Spre) and baseline total blood volume index, ΔR2MION. Black arrowheads in panel D mark representative high orientation-specific CBV foci (see panel G). E and F, Nonspecific BOLD and CBV magnitude maps. Note that the sites of high BOLD signals coincide well with the intracortical venous vessel locations. G and H, Specific CBV magnitude and orientation composite phase map. Representative pinwheel centers (or fractures) and high specific CBV signal foci are marked with solid white dots and black arrowheads, respectively.
Figure 6
Figure 6
Correlation between baseline blood volume maps and functional maps. A and B, Scatter plots of baseline venous CBV index, −ln (Spre) and total CBV, ΔR2MION (Fig. 5, C and D) vs. nonspecific BOLD map (Fig. 5E) in one animal. C and D, Scatter plots of baseline venous and total CBV vs. nonspecific and specific CBV maps (Fig. 5, F and G) in one animal. E and F, Bar graphs of group-averaged correlation coefficients. Data are mean ± SD of five cats. BOLDnsp(sp) and CBVnsp(sp) stand for the orientation-nonspecific (-specific) BOLD and CBV signals, respectively. Note that only the BOLD signal is significantly associated with the baseline venous and total CBV values.
Figure 7
Figure 7
Schematics of differential BOLD signals specific to columns. BOLD profiles with (black-dotted trace) and without (black trace) draining artifacts are compared. For the estimation of BOLD signals, multiple assumptions were made: 1) The venous CBV functional change is negligible, so the change in deoxyhemoglobin contents (relevant to BOLD) is the product of a change in total oxygenation level and baseline CBV. 2) Oxygenation-level change at capillaries obtained from the differential analysis is assumed to be localized to the neuronal sites with 500-μm full-width-half-maximum. 3) Intracortical veins are assumed to have 100-μm width, and contribute to the baseline CBV with a blurring effect (see Baseline venous CBV). Three hypothetical veins’ positions relative to columns are considered. Veins a, b and c are positioned in the center of an active column (gray regions), in an inactive column (white regions) shifted from its center, and in the boundary of active and inactive columns, respectively. Black vertical lines indicate the centers of the individual veins. Hypothetical draining territories of these individual veins (horizontal black bars marked with the same letters) and their draining effects are shown. The amount of draining in the vein was simulated by summation of oxygenation levels from given draining territories, then added to the oxygenation level change in capillaries to obtain the total oxygenation level change in each pixel. Black-dotted horizontal lines are the baselines of signal changes. Note that the BOLD localization to neuronal sites is even more distorted due to nonspecific draining artifacts to intracortical veins than only baseline venous CBV.

Similar articles

Cited by

References

    1. Attwell D, Buchan AM, Charpak S, Lauritzen M, MacVicar BA, Newman EA. Glial and neuronal control of brain blood flow. Nature. 2010;468:232–243. - PMC - PubMed
    1. Bell RD, Winkler EA, Sagare AP, Singh I, LaRue B, Deane R, Zlokovic BV. Pericytes Control Key Neurovascular Functions and Neuronal Phenotype in the Adult Brain and during Brain Aging. Neuron. 2010;68:409–427. - PMC - PubMed
    1. Berwick J, Johnston D, Jones M, Martindale J, Martin C, Kennerley AJ, Redgrave P, Mayhew JEW. Fine Detail of Neurovascular Coupling Revealed by Spatiotemporal Analysis of the Hemodynamic Response to Single Whisker Stimulation in Rat Barrel Cortex. Journal of Neurophysiology. 2008;99:787–798. - PMC - PubMed
    1. Bonhoeffer T, Grinvald A. The layout of iso-orientation domains in area 18 of cat visual ocrtex: optical imaging reveals a pin-wheel-like organization. The Journal of Neuroscience. 1993;13:4157–4180. - PMC - PubMed
    1. Chen LM, Turner GH, Friedman RM, Zhang N, Gore JC, Roe AW, Avison MJ. High-resolution maps of real and illusory tactile activation in primary somatosensory cortex in individual monkeys with functional magnetic resonance imaging and optical imaging. The Journal of Neuroscience. 2007;27:9181–9191. - PMC - PubMed

Publication types