

Stochastic modeling of stem-cell dynamics with control
- PMID: 22960597
- PMCID: PMC3921979
- DOI: 10.1016/j.mbs.2012.08.004
Stochastic modeling of stem-cell dynamics with control
Abstract
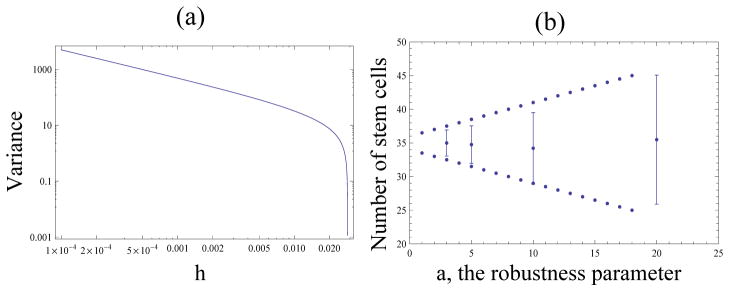
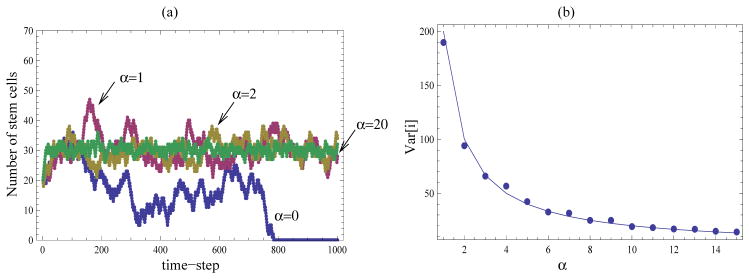
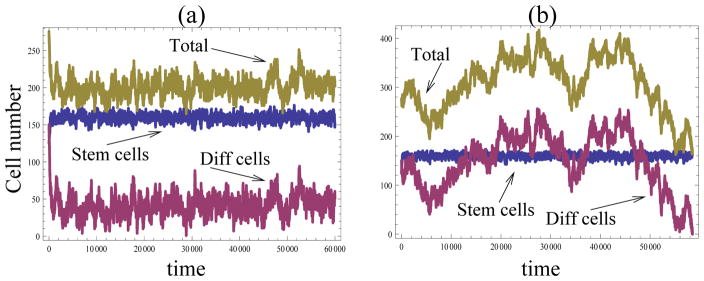
Tissue development and homeostasis are thought to be regulated endogenously by control loops that ensure that the numbers of stem cells and daughter cells are maintained at desired levels, and that the cell dynamics are robust to perturbations. In this paper we consider several classes of stochastic models that describe stem/daughter cell dynamics in a population of constant size, which are generalizations of the Moran process that include negative control loops that affect differentiation probabilities for stem cells. We present analytical solutions for the steady-state expectations and variances of the numbers of stem and daughter cells; these results remain valid for non-constant cell populations. We show that in the absence of differentiation/proliferation control, the number of stem cells is subject to extinction or overflow. In the presence of linear control, a steady state may be maintained but no tunable parameters are available to control the mean and the spread of the cell population sizes. Two types of nonlinear control considered here incorporate tunable parameters that allow specification of the expected number of stem cells and also provide control over the size of the standard deviation. We show that under a hyperbolic control law, there is a trade-off between minimizing standard deviations and maintaining the system robustness against external perturbations. For the Hill-type control, the standard deviation is inversely proportional to the Hill coefficient of the control loop. Biologically this means that ultrasensitive response that is observed in a number of regulatory loops may have evolved in order to reduce fluctuations while maintaining the desired population levels.
Copyright © 2012 Elsevier Inc. All rights reserved.
Figures
References
-
- Adimy M, Crauste F, Ruan S. Bull Math Biol. 2006;68:2321. - PubMed
-
- Agur Z, Daniel Y, Ginosar Y. Journal of mathematical biology. 2002;44(1):79. - PubMed
-
- Binetruy B, Heasley L, Bost F, Caron L, Aouadi M. Stem Cells. 2007;25:1090. - PubMed
-
- Boman BM, Fields JZ, Cavanaugh KL, Guetter A, Runquist OA. Cancer Res. 2008;68:3304. - PubMed
MeSH terms
Grants and funding
LinkOut - more resources
Full Text Sources
Medical
