. 2012 Sep;24(9):3795-804.
doi: 10.1105/tpc.112.098343. Epub 2012 Sep 7.

Novel plant immune-priming compounds identified via high-throughput chemical screening target salicylic acid glucosyltransferases in Arabidopsis

Affiliations

Novel plant immune-priming compounds identified via high-throughput chemical screening target salicylic acid glucosyltransferases in Arabidopsis

Yoshiteru Noutoshi et al. Plant Cell. 2012 Sep.

Abstract

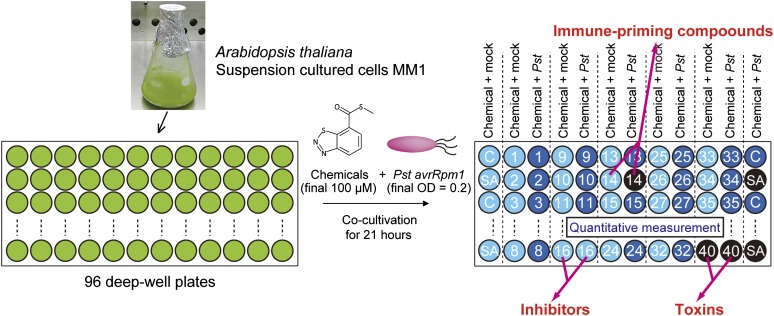
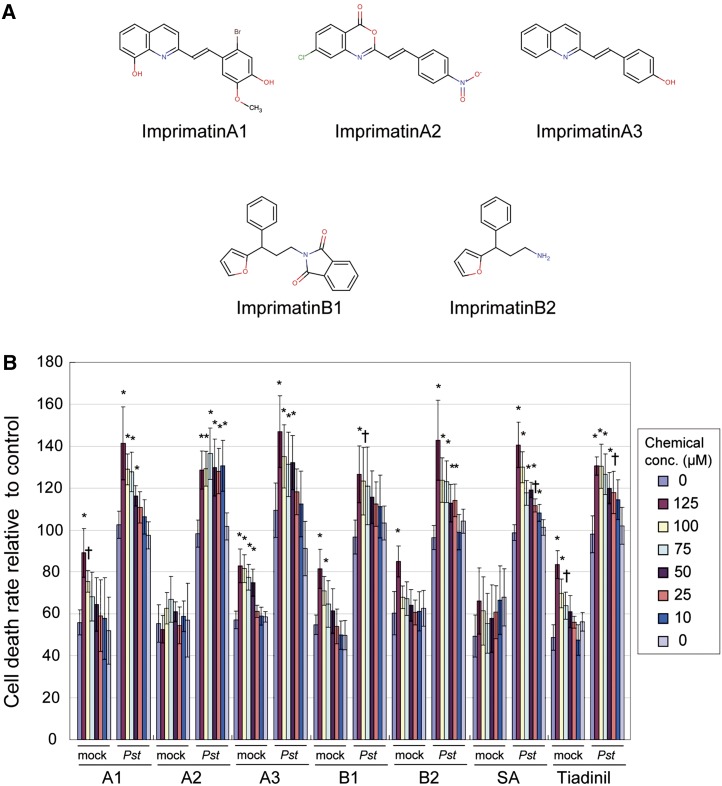
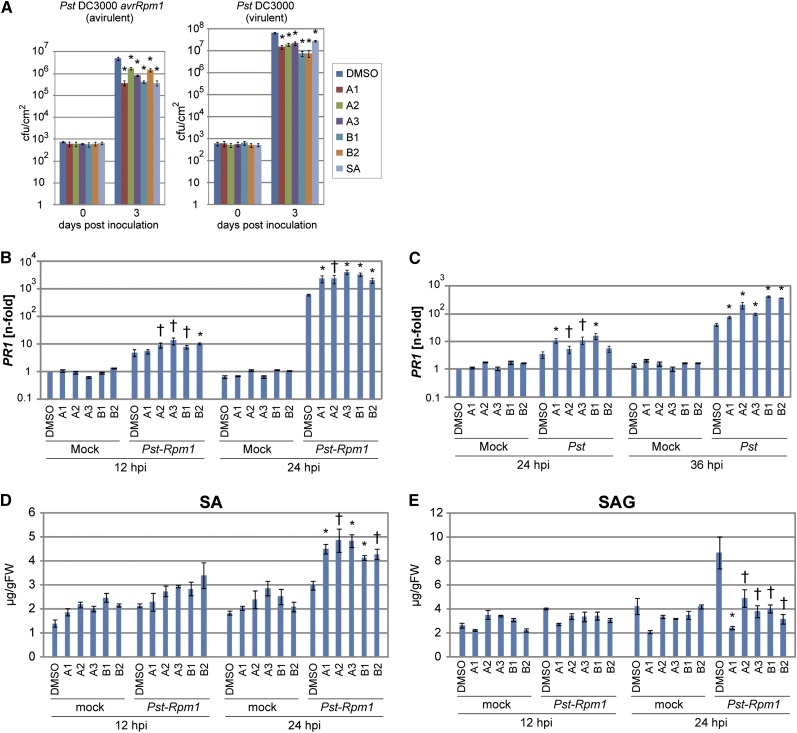
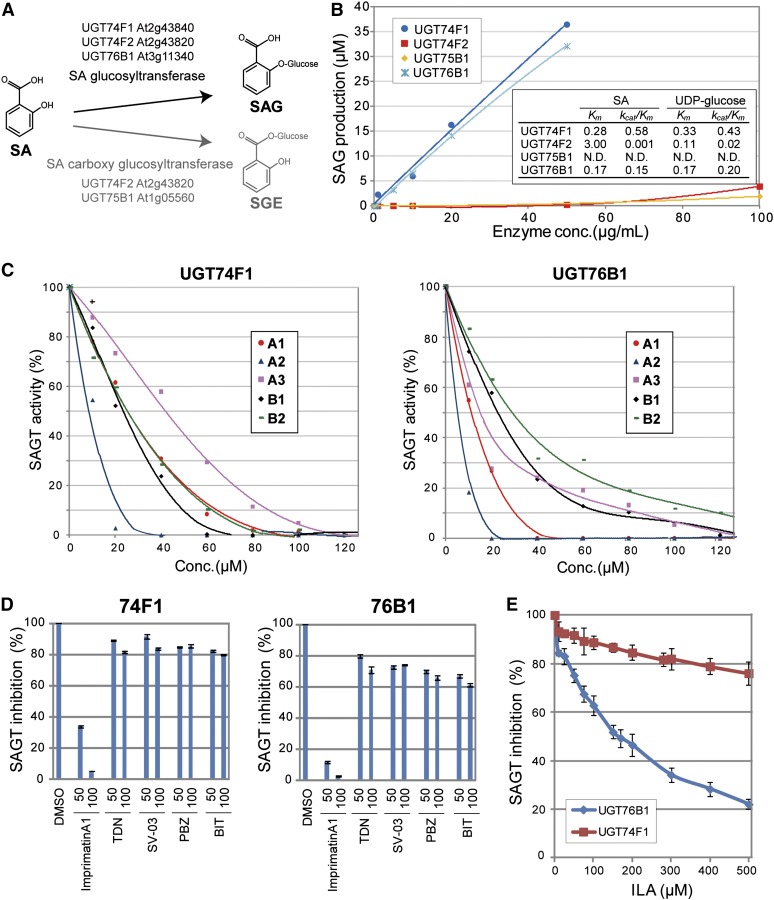
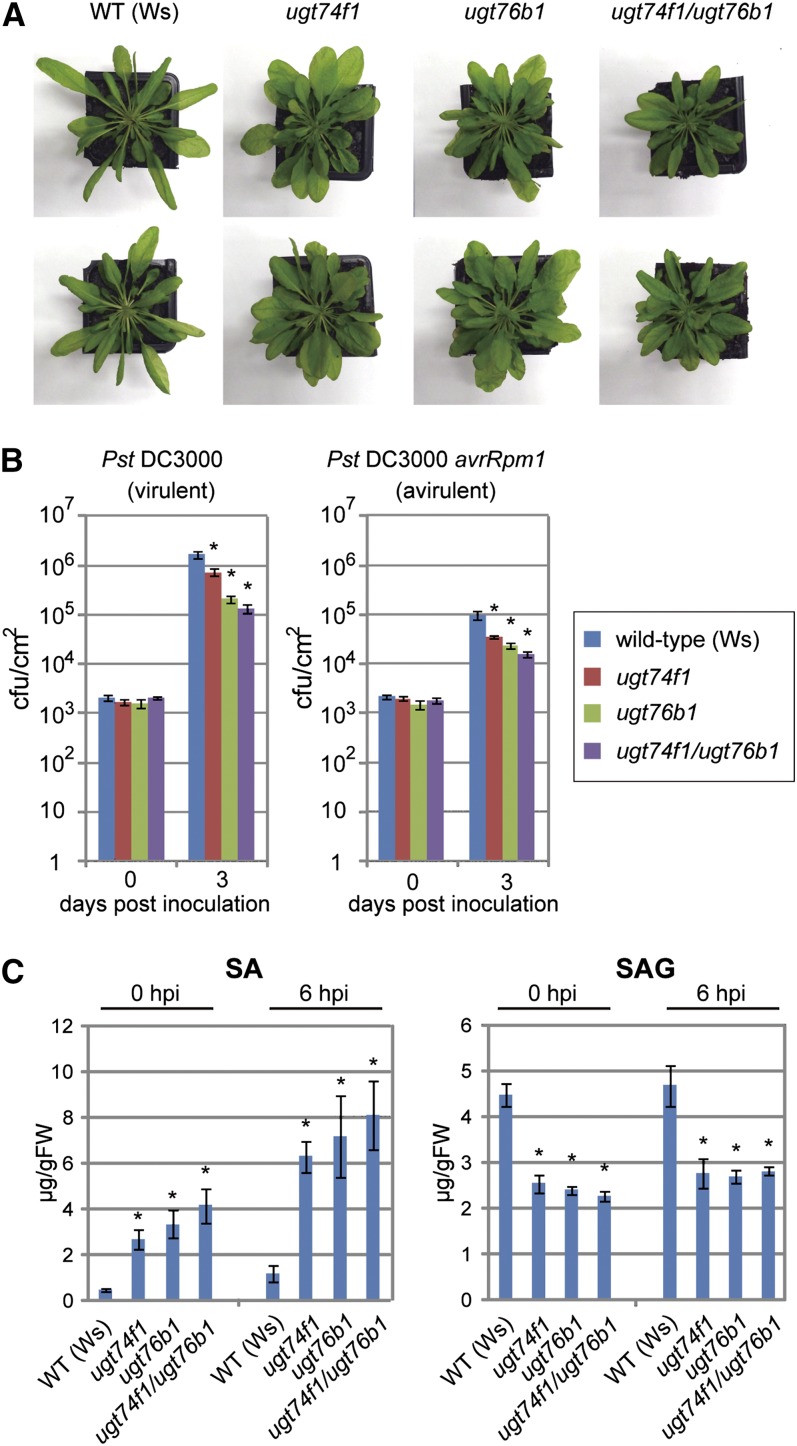
Plant activators are compounds, such as analogs of the defense hormone salicylic acid (SA), that protect plants from pathogens by activating the plant immune system. Although some plant activators have been widely used in agriculture, the molecular mechanisms of immune induction are largely unknown. Using a newly established high-throughput screening procedure that screens for compounds that specifically potentiate pathogen-activated cell death in Arabidopsis thaliana cultured suspension cells, we identified five compounds that prime the immune response. These compounds enhanced disease resistance against pathogenic Pseudomonas bacteria in Arabidopsis plants. Pretreatments increased the accumulation of endogenous SA, but reduced its metabolite, SA-O-β-d-glucoside. Inducing compounds inhibited two SA glucosyltransferases (SAGTs) in vitro. Double knockout plants that lack both SAGTs consistently exhibited enhanced disease resistance. Our results demonstrate that manipulation of the active free SA pool via SA-inactivating enzymes can be a useful strategy for fortifying plant disease resistance and may identify useful crop protectants.


Figures

Figure 1.
Figure 1.
Schematic Representation of the High-Throughput Screening Protocol for Plant Immune-Priming Compounds. Arabidopsis MM1 suspension cells were dispensed into each well of 96-deep well plates, and each chemical compound (final 25 µg/mL) was applied to columns. The bacteria Pst-avrRpm1 was added to only one column for each chemical. The final volume of each well is 100 µL. After 21 h of cocultivation, plant cells were incubated with Evans blue dye (0.05%) and washed with 1 mL of water. The dye was extracted and the absorbance at 595 nm was measured. DMSO (0.5%) and SA (100 µM) were used as negative and positive controls, respectively. The data were represented as relative to the mean of negative controls with Pst-avrRpm1. The detailed protocol is described in Methods and Supplemental Figure 4 online.
Figure 2.
Figure 2.
Compounds Isolated from the Chemical Screening. (A) Chemical structures of Imprimatins A1, A2, A3, B1, and B2. (B) The effects of Imprimatins on Arabidopsis suspension cell death upon inoculation with Pst-avrRpm1. For each compound, chemicals and bacteria were applied as indicated in the right panel. The cell death was measured as the concentration of Evans blue dye extracted from samples after staining. As a mock treatment, MgCl2 was added instead of pathogen. Cell death intensity is represented as relative value to the mean of the control (Pst + DMSO) of each experimental group (as 100). Error bars represent se (n = 4). *P < 0.01 and †P < 0.05; two-tailed Student’s t test with post-hoc Bonferroni’s correction.
Figure 3.
Figure 3.
Characterization of Disease Resistance Responses in Arabidopsis Plants Treated with Imprimatins. (A) Disease resistance against avirulent and virulent Pst strains induced by the treatment of Arabidopsis plants with Imprimatins. Seedlings hydroponically grown on rockwool for 3 weeks under short-day conditions were drenched in water containing each chemical (100 µM) for 3 d, followed by Pst strain inoculation into leaves. Bacterial growth inside leaves was measured 3 d after inoculation. Error bars represent se (n = 4). *P < 0.01; two-tailed Student’s t test. cfu, colony-forming units. (B) and (C) PR1 expression analysis in Imprimatin-treated Arabidopsis plants infected with avirulent (B) and virulent (C) Pst strains. The chemical-treated seedlings were spray inoculated with each strain of bacteria (OD600 = 0.05). PR1 transcript levels were determined by quantitative RT-PCR with cDNA prepared from samples at the indicated time points. The expression values of the individual genes were normalized using Actin2 as an internal standard. Error bars represent se (n = 3). *P < 0.01 and †P < 0.05; two-tailed Student’s t test. These results are representative of three independent replicates. (D) and (E) Measurement of endogenous SA (D) and SAG (E) during pathogen infection in the Imprimatin-treated Arabidopsis plants. The levels of SA and SAG were measured by HPLC using samples extracted from Arabidopsis seedlings inoculated with Pst-avrRpm1 as above. Error bars represent se (n = 3). *P < 0.01 and †P < 0.05; two-tailed Student’s t test. FW, fresh weight.
Figure 4.
Figure 4.
Inhibition of SAGT Activity. (A) Schematic representation of SA glucosylation patterns in Arabidopsis and the enzymes involved in each process. (B) Michaelis-Menten enzyme kinetics of SAGT. Concentration-dependent SAG production of UGT74F1, UGT74F2, and UGT76B1 in vitro were measured by HPLC using affinity-purified His-tagged recombinant proteins expressed in Escherichia coli. The kinetic parameter Km (mM) and the specificity constant kcat/Km (mM−1 s−1) were determined from the Lineweaver-Burk plots (see Supplemental Figure 7 online). These results are the means of three independent replicates. (C) Inhibition of SAGT activities of UGT74F1 (left panel) and UGT76B1 (right panel) by Imprimatins. The SAG produced by each enzyme was analyzed by HPLC in a reaction mixture containing SA at each Km concentration (Conc.). Values were plotted relative to the control of four independent experiments. (D) Effect of known plant activators on the SAGT activities of UGT74F1 (left panel) and UGT76B1 (right panel). SAG levels were measured with tiadinil (TDN), probenazole (PBZ), SV-03 (SV), or 1,1-dioxo-1,2-benzothiazol-3-one (BIT) at the indicated concentrations (µM). Imprimatin A1 was used as a positive control. Data shown are relative to the DMSO control. Error bars represent se (n = 3). (E) Effects of isoleucic acid (ILA) on the SAGT activities of UGT74F1 and UGT76B1. SAG was measured in the presence of different concentrations of ILA. Data represent relative values to each control. Error bars represent se (n = 3).
Figure 5.
Figure 5.
Arabidopsis SAGT Knockout Mutants. (A) Phenotypes of SAGT knockout mutants. Wild-type (WT; Wassilewskija [Ws]), ugt74f1, ugt76b1, and ugt74f1 ugt76b1 Arabidopsis plants were grown on soil for 4 weeks under short-day conditions. (B) Disease resistance of the ugt74f1 and ugt76b1 single and double mutants to both avirulent and virulent Pst strains. Bacteria were infiltrated into rosette leaves of 4-week-old plants grown under short-day conditions. Pathogen growth in leaves was monitored at 0 and 3 d after inoculation. Error bars represent se (n = 12). *P < 0.01; two-tailed Student’s t test. cfu, colony-forming units. (C) Endogenous SA and SAG levels in the ugt74f1 and ugt76b1 single and double mutants. Plants were grown on soil for 4 weeks under short-day conditions, and Pst-avrRpm1 was inoculated by spraying. Rosette leaves were sampled for measurement using HPLC. Error bars represent se (n = 4). *P < 0.01; two-tailed Student’s t test. FW, fresh weight; hpi, hours post inoculation.

Similar articles

Cited by

References

    1. Cartwright A.M., Lim E.K., Kleanthous C., Bowles D.J. (2008). A kinetic analysis of regiospecific glucosylation by two glycosyltransferases of Arabidopsis thaliana: Domain swapping to introduce new activities. J. Biol. Chem. 283: 15724–15731 - PMC - PubMed
    1. Dangl J.L., Jones J.D. (2001). Plant pathogens and integrated defence responses to infection. Nature 411: 826–833 - PubMed
    1. Dean J.V., Mohammed L.A., Fitzpatrick T. (2005). The formation, vacuolar localization, and tonoplast transport of salicylic acid glucose conjugates in tobacco cell suspension cultures. Planta 221: 287–296 - PubMed
    1. Dempsey D.A., Vlot A.C., Wildermuth M.C., Klessig D.F. (2011). Salicylic acid biosynthesis and metabolism. The Arabidopsis Book 9: e0156, doi/10.1199/tab.0156 - PMC - PubMed
    1. Girke T., Cheng L.C., Raikhel N. (2005). ChemMine. A compound mining database for chemical genomics. Plant Physiol. 138: 573–577 - PMC - PubMed

Publication types

MeSH terms