. 2012 Oct;13(10):972-80.
doi: 10.1038/ni.2420. Epub 2012 Sep 9.

A multiply redundant genetic switch 'locks in' the transcriptional signature of regulatory T cells

Affiliations

A multiply redundant genetic switch 'locks in' the transcriptional signature of regulatory T cells

Wenxian Fu et al. Nat Immunol. 2012 Oct.

Abstract

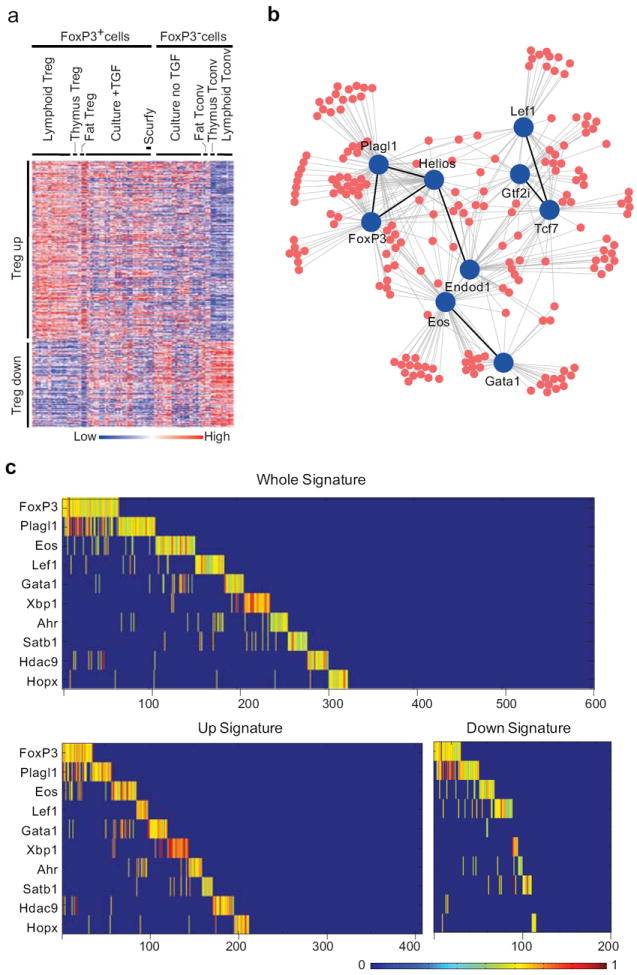
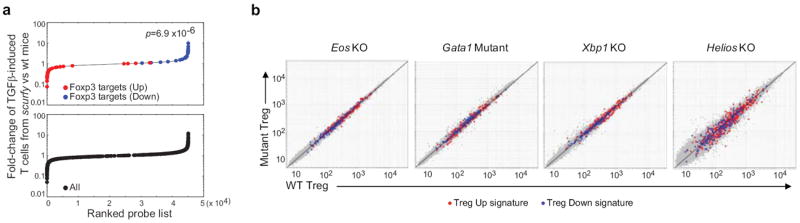
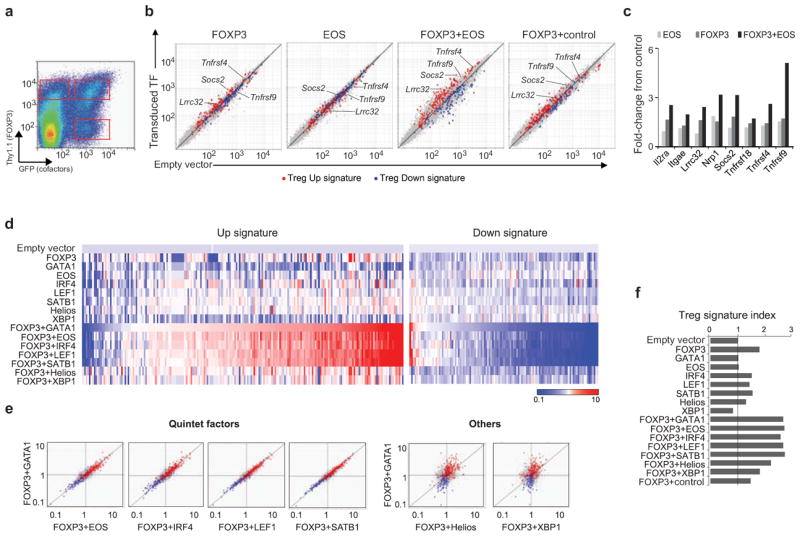
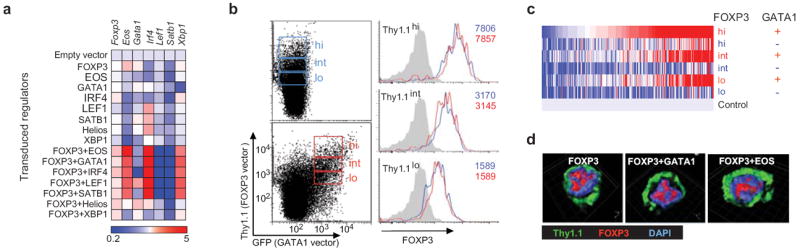
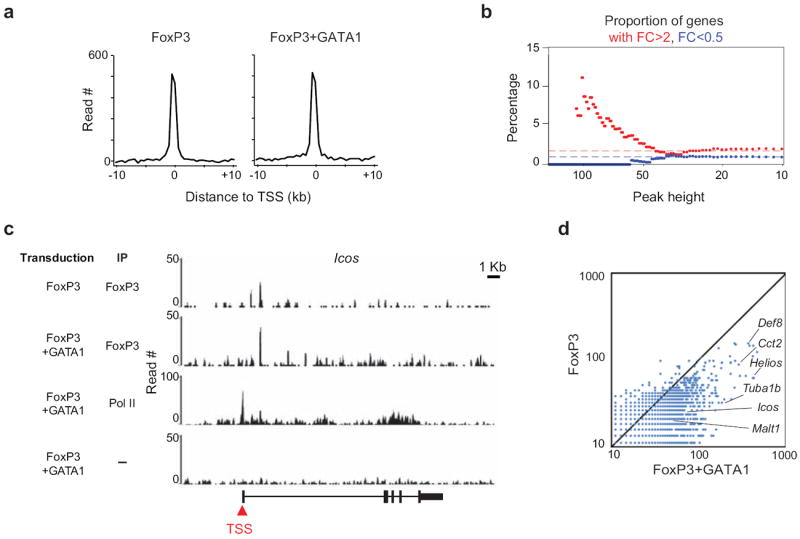
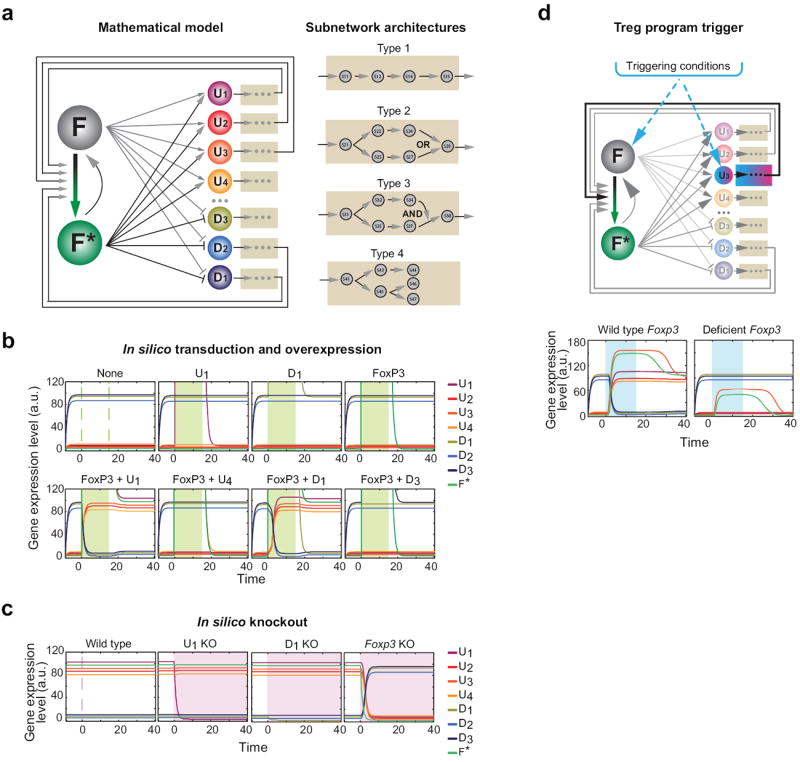
The transcription factor Foxp3 participates dominantly in the specification and function of Foxp3(+)CD4(+) regulatory T cells (T(reg) cells) but is neither strictly necessary nor sufficient to determine the characteristic T(reg) cell signature. Here we used computational network inference and experimental testing to assess the contribution of other transcription factors to this. Enforced expression of Helios or Xbp1 elicited distinct signatures, but Eos, IRF4, Satb1, Lef1 and GATA-1 elicited exactly the same outcome, acting in synergy with Foxp3 to activate expression of most of the T(reg) cell signature, including key transcription factors, and enhancing occupancy by Foxp3 at its genomic targets. Conversely, the T(reg) cell signature was robust after inactivation of any single cofactor. A redundant genetic switch thus 'locked in' the T(reg) cell phenotype, a model that would account for several aspects of T(reg) cell physiology, differentiation and stability.


Conflict of interest statement

COMPETING FINANCIAL INTERESTS

The authors declare no competing financial interests.

Figures

Figure 1
Figure 1. Computational prediction of TFs in control of the Treg signature
(a) Heatmap of the expression profiles used in the computational reconstruction, which included matched pairs of FoxP3+ and FoxP3- cells; scurfy: TGF-β-treated cultures of CD4+ T cells from Foxp3-null scurfy mice. Genes in rows, populations in columns (see Supplementary Table 1). (b) TFs (blue) most highly connected to Treg signature genes (red), as predicted by the CLR algorithm. (c) Result of a mathematical optimization, run in ILOG Cplex from the CLR scores of 1a, selecting combinations of TFs to maximize the portion of the Treg signature explained. In the optimal solution shown here, the 10 factors together account for 330 of the 603 Treg signature genes, FoxP3 explaining the most. Color scale represents the intensity of the influence of each factor; blue background, no effect; green-yellow-red: increasing impact.
Figure 2
Figure 2. Validity of the predicted FoxP3 targets
(a) The distribution of expression ratio in TGF-β-induced T cells from scurfy mice vs. those from wildtype mice is plotted for CLR-predicted targets (top) or for the whole Treg signature (bottom); note the more extreme distribution of CLR-predicted FoxP3-target genes. Statistical significance was determined with Kolmogorov-Smirnov test. (b) Gene expression profiling in Treg cells deficient or mutant in CLR-predicted TFs as indicated, compared to their WT littermates. Values averaged from duplicates.
Figure 3
Figure 3. Transcriptional induction of Treg signature by FoxP3 and other TFs
Purified mouse Tconv cells were activated and retrovirally transduced with expression vectors encoding FOXP3 (with a Thy1.1 reporter), and various cofactors (with a GFP reporter), and sorted after 3 days of culture. (a) Representative cytometry profile of double-transduced cells. (b) Expression profiles of Tconv cells transduced with FOXP3 and EOS, alone or together, as well as FOXP3 plus a control TF (Pbx1), were compared to that of cells transduced with empty vectors (the x-axis). Values were averaged from independent triplicates. Note that international nomenclature is followed, using mouse terminology in general (first letter uppercase), human when required (all uppercase), and genes italics. (c) RT-PCR quantitation of representative Treg signature genes in an independent set of samples. Shown are normalized fold-changes to control vector transduced cells. GITR (Tnfrsf18), Ox40 (Tnfrsf4), 4-1BB (Tnfrsf9). (d) Heatmap representation of Treg Up and Down signature genes after transduction of candidate TFs, alone or with FOXP3 (average triplicated). (e) Direct comparison of Treg signature changes in cells transduced with FOXP3 plus different cofactors (FoldChange relative to control). The y-axis in all panels represents changes elicited by FOXP3+GATA1. (f) Overall extent of the transition towards Treg phenotype, assessed by a cumulative Treg signature index.
Figure 4
Figure 4. Mechanistic impact of FoxP3 cofactors
(a) Expression of endogenous transcripts of Foxp3 and cofactors in transduced cells. (b) CD4+ Tconv cells transduced with FOXP3 (blue) or FOXP3+GATA1 (red) were sorted into matching bins of Thy1.1 reporter intensities, and the levels of FOXP3 determined by intracellular staining. Numbers indicate the MFI of FOXP3 protein. (c) Heatmap representation of the expression of Treg Up signature genes in expression profiles of cells transduced and sorted into FOXP3 expression bins as in (b). (d) Confocal microscopy of CD4+ cells transduced with FOXP3 and other TFs, stained for FOXP3, Thy1.1, and DNA (DAPI).
Figure 5
Figure 5. Genome-wide analysis of FoxP3
Mapping of FoxP3 by ChIP-seq, comparing genome-wide distribution in CD4+ Tconv cells transduced with Flag-FoxP3, with or without GATA1. (a) Cumulative distribution of FoxP3 protein (in 25 bp bins) in a 10 kb window relative to the TSS of the closest genes. (b) Relationship between FoxP3 binding (peak height = max sequence tag pileup within 10kb of a gene) versus regulation by FoxP3 (the proportion of genes with transduction FoldChange >2 or <0.5 in FoxP3+GATA1 versus empty vector control for all genes with peak height >=x). (c) Binding of FoxP3 over the Icos genomic locus. (d) Comparison read number for significant peaks (MACS p-value <10-7). Representative FoxP3-bound genes are highlighted.
Figure 6
Figure 6. Mathematical modeling of a ‘self-locking’ network
(a) Schematic of a mathematical model consisting of the main regulator FoxP3 (F), with its active conformation F* (where this transition can represent transcriptional or post-transcriptional activation) and a set of downstream regulatory factors of the Treg signature, either up- (Ui’s) and down-regulated (Di’s). Subsets of the signature genes (U1-3, D1-2) positively activate the F to F* transition, directly or through the subnetworks they control. (b) In silico simulation of transduction and overexpression experiments. Expression levels of the TFs (arbitrary units) shown as colored lines; green shading represent the time window of over-expression of the indicated factors. (c) Simulated knockout experiments. Pink-shading areas correspond to the time frames after elimination of the factors shown. (d) Activation of the Treg program. Blue shading represents the time window during which the inducing conditions are present.

Comment in

References

    1. Sakaguchi S, Yamaguchi T, Nomura T, Ono M. Regulatory T cells and immune tolerance. Cell. 2008;133:775–787. - PubMed
    1. Feuerer M, et al. Lean, but not obese, fat is enriched for a unique population of regulatory T cells that affect metabolic parameters. Nat Med. 2009;15:930–939. - PMC - PubMed
    1. Josefowicz SZ, Lu LF, Rudensky AY. Regulatory T Cells: Mechanisms of Differentiation and Function. Annu Rev Immunol. 2012 - PMC - PubMed
    1. Curotto de Lafaille MA, Lafaille JJ. Natural and adaptive foxp3+ regulatory T cells: more of the same or a division of labor? Immunity. 2009;30:626–635. - PubMed
    1. Duarte JH, et al. Natural Treg cells spontaneously differentiate into pathogenic helper cells in lymphopenic conditions. Eur J Immunol. 2009;39:948–955. - PubMed

Publication types

MeSH terms

Substances