. 2012 Oct;18(10):1539-49.
doi: 10.1038/nm.2899. Epub 2012 Sep 9.

MitoNEET-driven alterations in adipocyte mitochondrial activity reveal a crucial adaptive process that preserves insulin sensitivity in obesity

Affiliations

MitoNEET-driven alterations in adipocyte mitochondrial activity reveal a crucial adaptive process that preserves insulin sensitivity in obesity

Christine M Kusminski et al. Nat Med. 2012 Oct.

Abstract

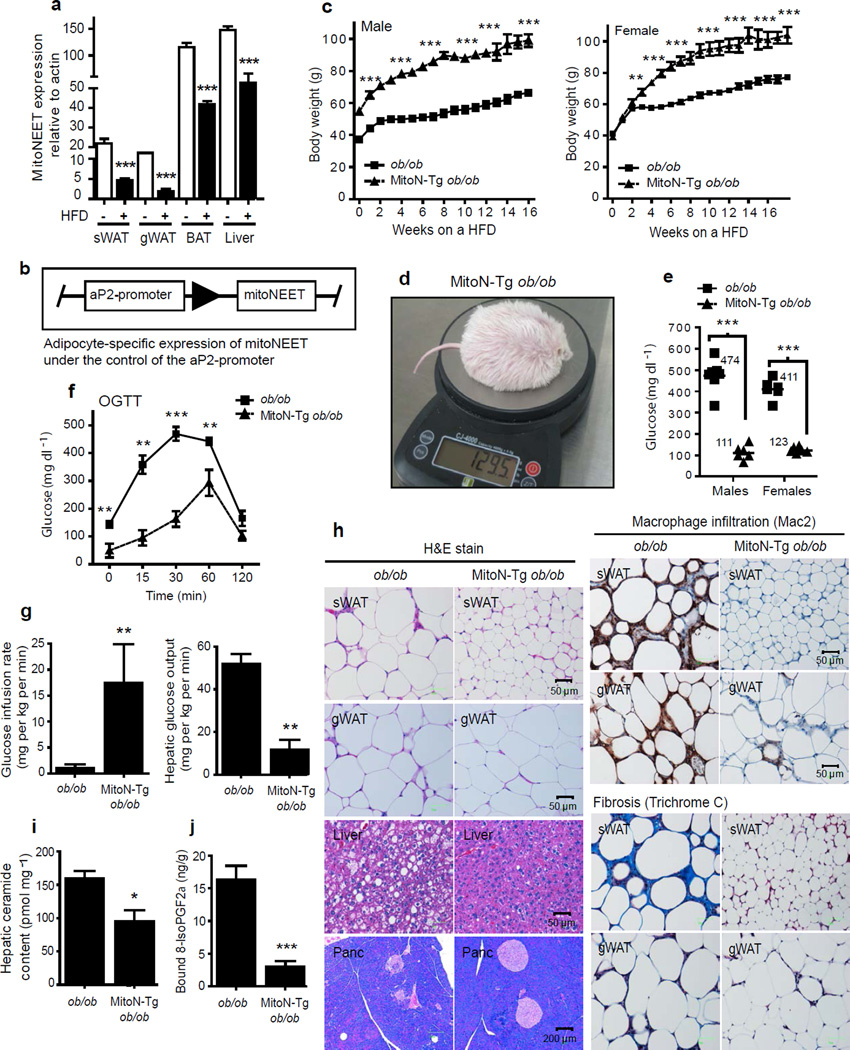
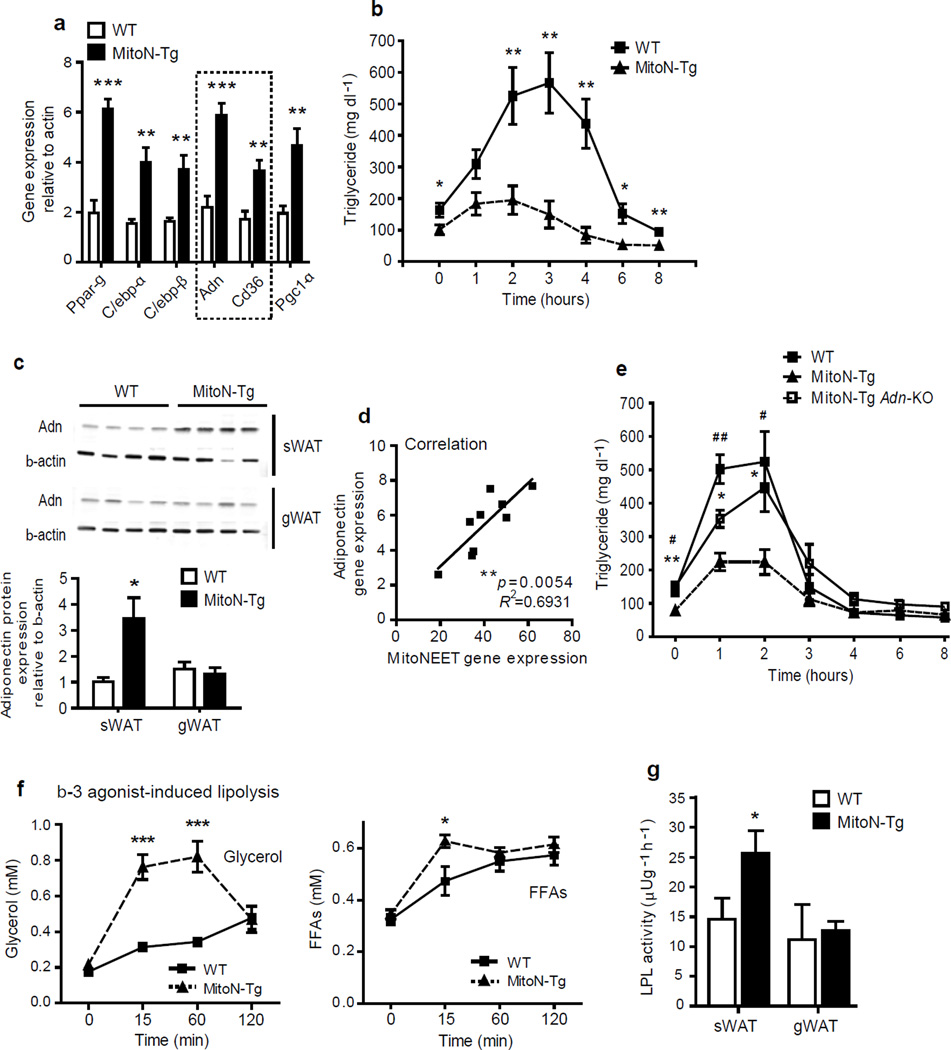
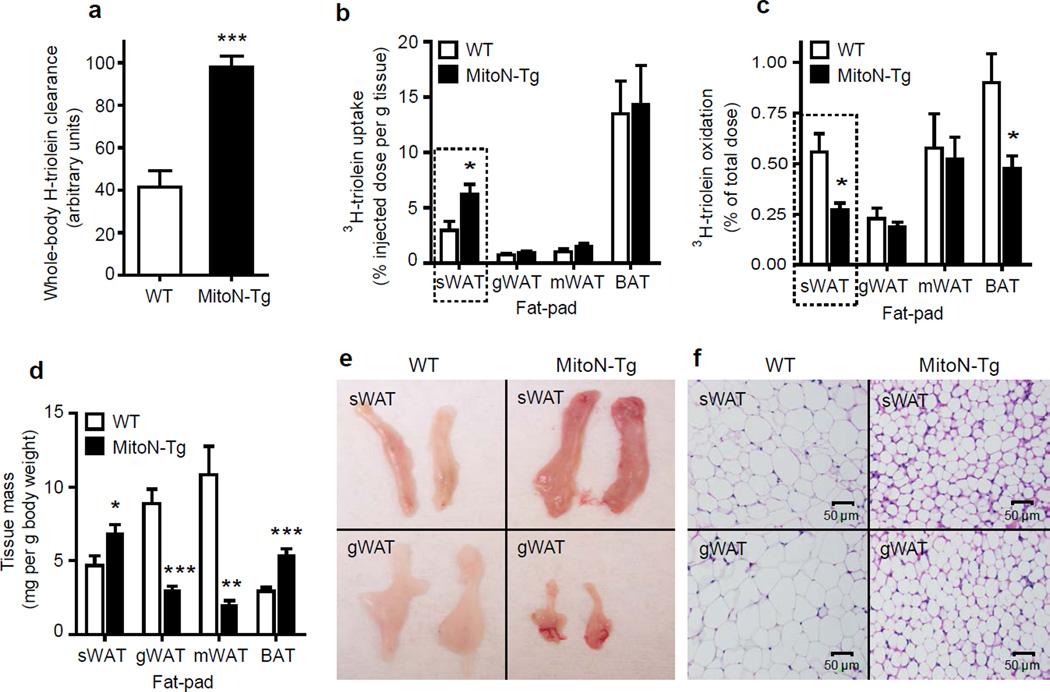
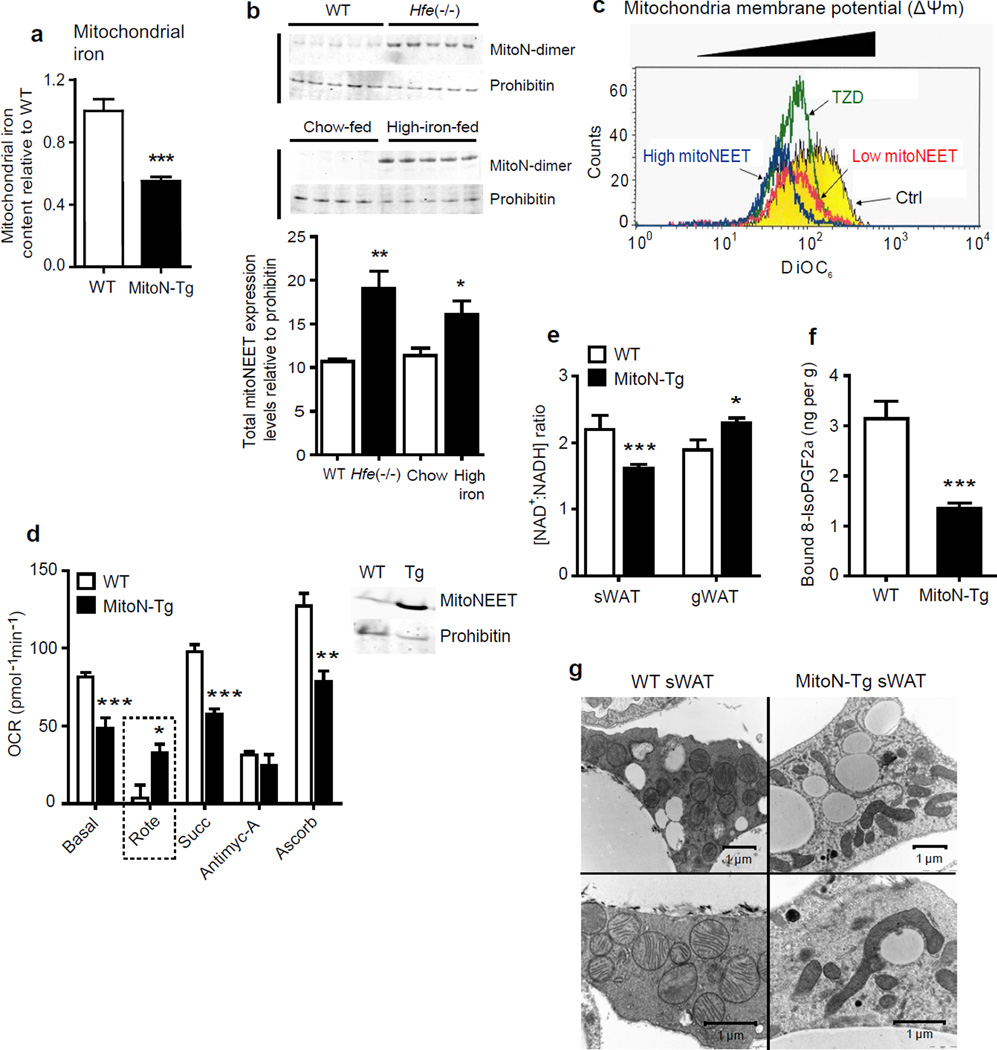
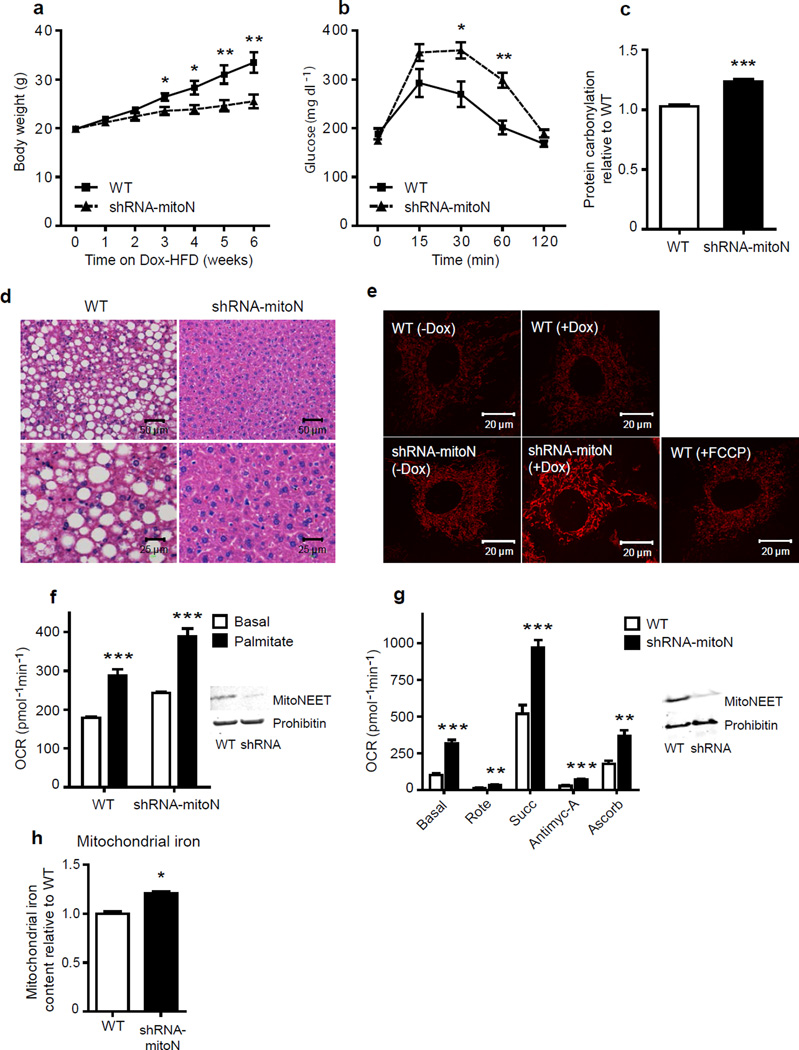
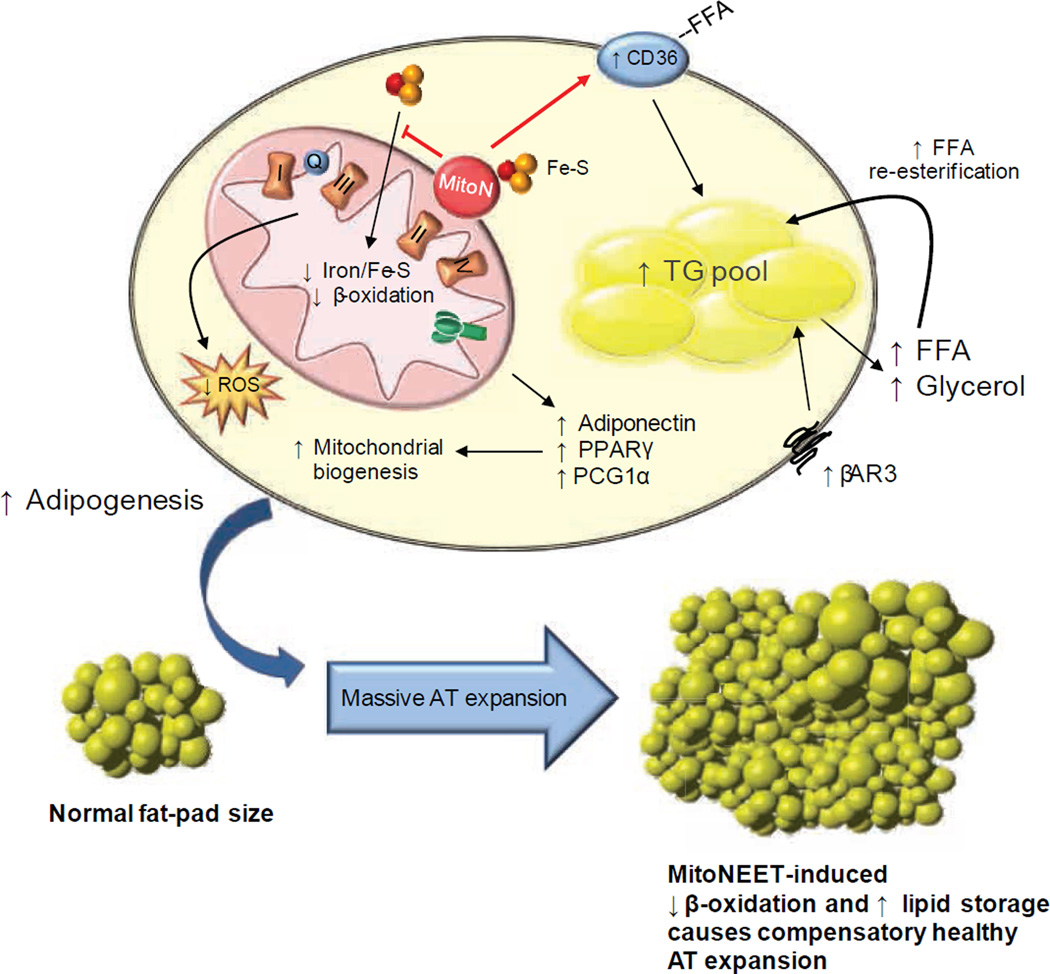
We examined mouse models with altered adipocyte expression of mitoNEET, a protein residing in the mitochondrial outer membrane, to probe its impact on mitochondrial function and subsequent cellular responses. We found that overexpression of mitoNEET enhances lipid uptake and storage, leading to an expansion of the mass of adipose tissue. Despite the resulting massive obesity, benign aspects of adipose tissue expansion prevail, and insulin sensitivity is preserved. Mechanistically, we also found that mitoNEET inhibits mitochondrial iron transport into the matrix and, because iron is a rate-limiting component for electron transport, lowers the rate of β-oxidation. This effect is associated with a lower mitochondrial membrane potential and lower levels of reactive oxygen species-induced damage, along with increased production of adiponectin. Conversely, a reduction in mitoNEET expression enhances mitochondrial respiratory capacity through enhanced iron content in the matrix, ultimately corresponding to less weight gain on a high-fat diet. However, this reduction in mitoNEET expression also causes heightened oxidative stress and glucose intolerance. Thus, manipulation of mitochondrial function by varying mitoNEET expression markedly affects the dynamics of cellular and whole-body lipid homeostasis.


Figures

Figure 1
Figure 1
MitoNEET causes massive AT expansion and improves hepatic insulin sensitivity. (a) MitoNEET levels in sWAT, gWAT, BAT and liver tissues from male FVB WT mice following 6-weeks of HFD feeding (n = 4 per group). (b) Schematic of the adipose-specific aP2-promoter-driven expression of mitoNEET. (c) Body-weights during HFD-feeding of male and female FVB ob/ob mice and MitoN-Tg ob/ob mice (n = 6 per group). (d) A photograph of the heaviest HFD-challenged MitoN-Tg FVB ob/ob female mouse to date. (e) Fed-state systemic glucose levels during HFD-feeding of FVB male and female ob/ob mice and MitoN-Tg ob/ob mice (n = 6 per group). (f) An OGTT (2.5 g kg−1 body-weight; single gavage) on female FVB ob/ob and MitoN-Tg ob/ob mice (n = 5 per group). (g) Glucose infusion rates (left) and hepatic glucose output (right) during hyperinsulinemic-euglycemic clamps that were performed on conscious unrestrained 10 week-old female FVB ob/ob mice and MitoN-Tg ob/ob mice (n = 5 per group). (h) H&E staining (left), macrophage-infiltration (Mac2-immunohistochemistry) (top right) and fibrosis (Trichrome stain) (bottom right) of chow-fed FVB female ob/ob and MitoN-Tg ob/ob sWAT, gWAT, liver and pancreas, respectively. (i) Hepatic ceramide content in female FVB ob/ob mice and MitoN-Tg ob/ob mice (n = 4 per group). (j) Lipid-induced (15 ul g−1 body-weight 20% intralipid; single gavage) ROS-promoted lipid damage (lipid-peroxidation, as measured by bound 8-isoPGF2α levels) in FVB female ob/ob and MitoN-Tg ob/ob sWAT (n = 5 per group). *P < 0.05; **P < 0.01; ***P < 0.001.
Figure 2
Figure 2
MitoNEET promotes lipid-uptake by stimulating adiponectin production and heightening β-3 adrenergic agonist sensitivity. (a) RT-PCR showing gene expression levels of key microarray hits from male FVB WT versus MitoN-Tg sWAT (n = 9 per group). (b) TG clearance test (20% intralipid; 15 ul g−1 body-weight; single gavage) in male FVB WT versus MitoN-Tg mice (n = 6 per group). (c) Western blot demonstrating adiponectin expression in WT and MitoN-Tg sWAT and gWAT fat-pads (n = 4 per group). (d) The correlation between mitoNEET transgene levels and endogenous adiponectin message levels in MitoN-Tg sWAT (n = 9 per group). (e) TG clearance test (20% intralipid; 15 ul g−1 body-weight; single gavage) in male FVB WT mice, MitoN-Tg mice and MitoN-Tg Adn-KO mice (n = 6 per group). (f) Circulating glycerol level (left) and FFA levels (right) in male FVB WT and MitoN-Tg mice during a β-3 adrenergic agonist sensitivity test (1 mg kg−1 CL316, 243 i.p., n = 7 per group). (g) LPL activity in WT and MitoN-Tg sWAT and gWAT (n = 5 per group).
Figure 3
Figure 3
MitoNEET induced alterations in fatty acid metabolism. (a) Whole-body 3H-triolein lipid-clearance in male FVB WT mice versus MitoN-Tg mice, following 15 min post injection (2 µCi/mouse in 100 ul of 5% intralipid; single tail-vein injection) (n = 6 per group). (b) 3H-triolein lipid-uptake, (c) β-oxidation and (d) tissue-mass in sWAT, gWAT, mWAT and BAT fat-pads of WT versus MitoN-Tg mice (n = 6 per group). (e) A representative photograph and (f) H&E staining of sWAT and gWAT fat-pads from a WT and MitoN-Tg mouse. *P < 0.05; **P < 0.01; ***P < 0.001.
Figure 4
Figure 4
MitoNEET compromises mitochondrial dynamics and morphology by modulating mitochondrial iron content. (a) Mitochondrial iron content in WT sWAT versus MitoN-Tg sWAT (n = 7 per group). ***P < 0.001. (b) Total mitoNEET expression levels (monomer and dimer) in WT mice versus Hfe−/− mice (top panel), in addition to chow-fed control mice versus high iron-diet-fed (n = 5 per group). (b) Mitochondrial membrane potential (ΔΨm) using DiOC6 incubated with control vehicle, or low- and high-mitoNEET expressing 3T3-L1 preadipocytes. Yellow-panel: control vehicle; green-panel: TZD-treated; red-panel: low mitoNEET expression; blue-panel: high mitoNEET expression. (d) Oxygen-consumption rates (OCRs) in mitochondria (1 µg) isolated from WT (blue-panel) and MitoN-Tg (red-panel) sWAT, in response to sequential additions of DMEM (containing FCCP and, the substrates pyruvate and malate), rotenone (complex I inhibitor), succinate (complex II substrate), antimycin-A (complex III inhibitor), ascorbate and TMPD (cytochrome c substrate) (n = 4 per group). Prohibitin was utilized as a mitochondrial protein loading control. (e) NAD+: NADH ratio in WT and MitoN-Tg sWAT and gWAT (n = 5 per group). (f) Lipid-induced (15 ul g−1 body-weight 20% intralipid; single gavage with tissues harvested following 6 h induction) ROS-promoted lipid damage (lipid-peroxidation, as measured by bound 8-isoPGF2α levels) in WT and MitoN-Tg sWAT (n = 5 per group). (g) Representative EM images (16,500× and 26,500× magnifications) of unchallenged WT and MitoN-Tg sWAT.
Figure 5
Figure 5
A lack in mitoNEET enhances mitochondrial oxidative capacity. (a) Body-weight gain in male C57/BL6 WT and shRNA-mitoN mice during Dox-HFD feeding (n = 5 per group). (b) An OGTT (2.5 g kg−1 body-weight; single gavage) on male C57/BL6 WT and shRNA-mitoN mice following Dox-HFD-feeding (n = 5 per group). (c) Hepatic ROS-induced protein damage (protein carbonylation) in male C57/BL6 WT and shRNA-mitoN mice following Dox-HFD feeding (n = 5 per group). (d) Representative H&E staining of WT and shRNA-MitoN livers following Dox-HFD feeding. (e) TMRM-treated WT and shRNA-MitoN MEFs (with or without Dox-treatment) to assess ΔΨm. The chemical uncoupler FCCP was utilized as an additional control. All images were taken by confocal microscopy at 63× magnification. (f) OCRs in Dox-treated WT and shRNA-MitoN MEFs in response to basal-conditions (low glucose), followed by the addition of palmitate, then etomoxir (a carnitine palmitoyltransferase-1 inhibitor), to specify inhibition of CPT-1 dependent β-oxidation (n = 10 per group). (g) OCRs for mitochondria (5 µg) isolated from liver tissues from Dox-chow fed WT (blue-panel) and shRNA-MitoN (red-panel) mice, in response to sequential additions of DMEM (containing FCCP and the substrates pyruvate and malate), rotenone, succinate, antimycin-A, then ascorbate and TMPD (n = 4 per group). Prohibitin was used as a mitochondrial protein loading control. (h) Mitochondrial iron content in WT liver versus shRNA-mitoN liver (n = 7 per group). *P < 0.05; **P < 0.01; ***P < 0.001.
Figure 6
Figure 6. Proposed mechanism of mitoNEET action
Schematic representation of the intracellular involvement of mitoNEET in adipocyte physiology based on its ability to manipulate mitochondrial function. There are system-wide metabolic consequences arising from a mitoNEET-induced mitochondrial perturbation at the level of the adipocyte. MitoNEET i) impacts mitochondrial iron content, which may contribute to the decline in β-oxidation and, ii) enhances FA-uptake by signaling via Cd36. Compromised mitochondrial function therefore triggers a compensatory upregulation of adipogenesis, β-3 adrenergic signaling and mitochondrial biogenesis. The cellular decrease in mitochondrial activity further enhances lipid-influx into the cell. The inability to utilize these lipids effectively in mitochondria shunts surplus substrates into the TG pool. Consequently, low β-oxidation rates, high Ppar-γ activity accompanied by excess lipid storage, results in gross AT expansion. The ability to store massive amounts of lipids in sWAT results in a highly beneficial system-wide improvement in whole-body insulin-sensitivity, with minimized lipotoxic effects in other tissues.

Similar articles

Cited by

References

    1. Muoio DM, Newgard CB. Obesity-related derangements in metabolic regulation. Annu Rev Biochem. 2006;75:367–401. - PubMed
    1. Lowell BB, Shulman GI. Mitochondrial dysfunction and type 2 diabetes. Science. 2005;307:384–387. - PubMed
    1. Mehta JL, Rasouli N, Sinha AK, Molavi B. Oxidative stress in diabetes: a mechanistic overview of its effects on atherogenesis and myocardial dysfunction. Int J Biochem Cell Biol. 2006;38:794–803. - PubMed
    1. Morino K, Petersen KF, Shulman GI. Molecular mechanisms of insulin resistance in humans and their potential links with mitochondrial dysfunction. Diabetes. 2006;2(55 Suppl):S9–S15. - PMC - PubMed
    1. Kim JY, et al. Obesity-associated improvements in metabolic profile through expansion of adipose tissue. J Clin Invest. 2007;117:2621–2637. - PMC - PubMed

Publication types

MeSH terms

Associated data