

Cytoskeletal stiffness, friction, and fluidity of cancer cell lines with different metastatic potential
- PMID: 22961212
- PMCID: PMC3871859
- DOI: 10.1007/s10585-012-9531-z
Cytoskeletal stiffness, friction, and fluidity of cancer cell lines with different metastatic potential
Abstract
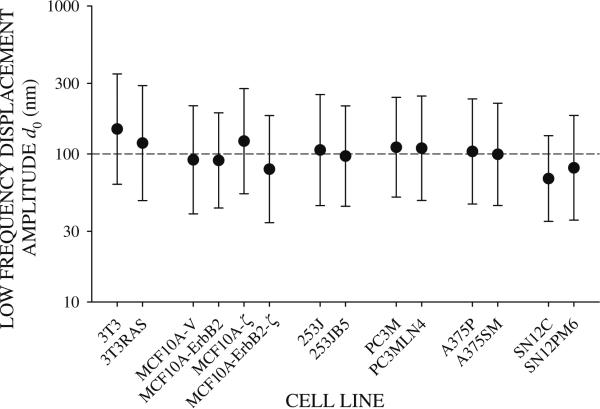
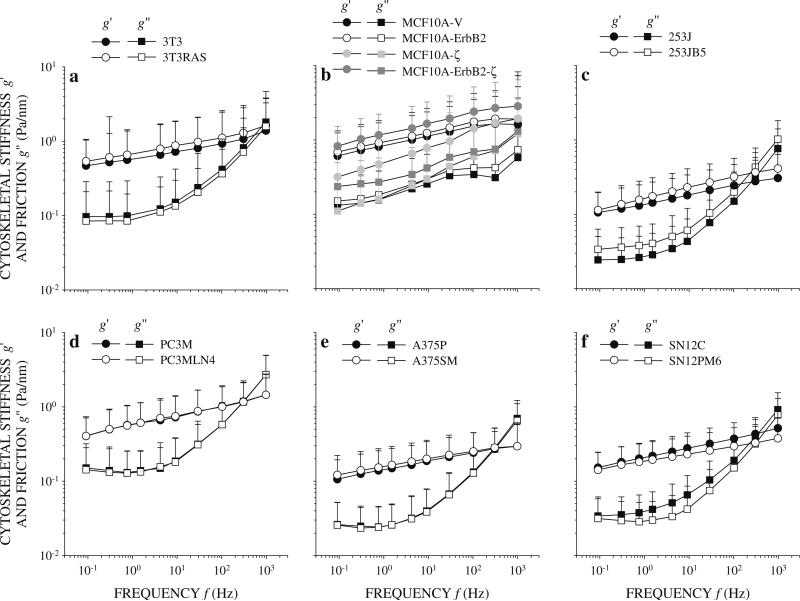
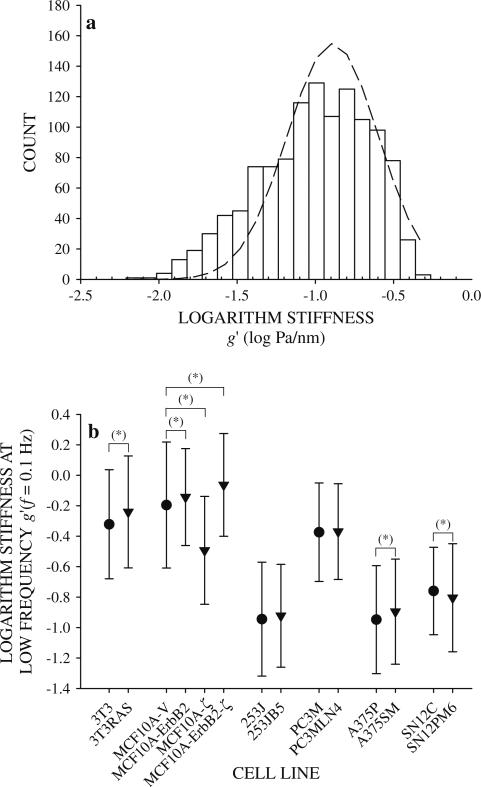
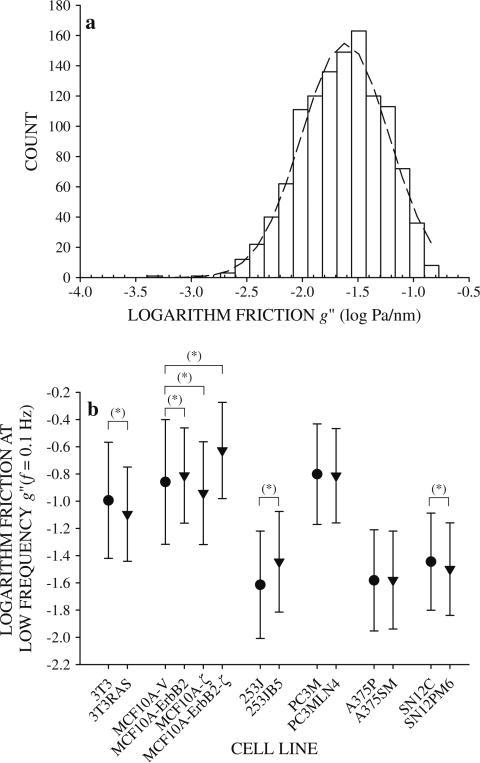
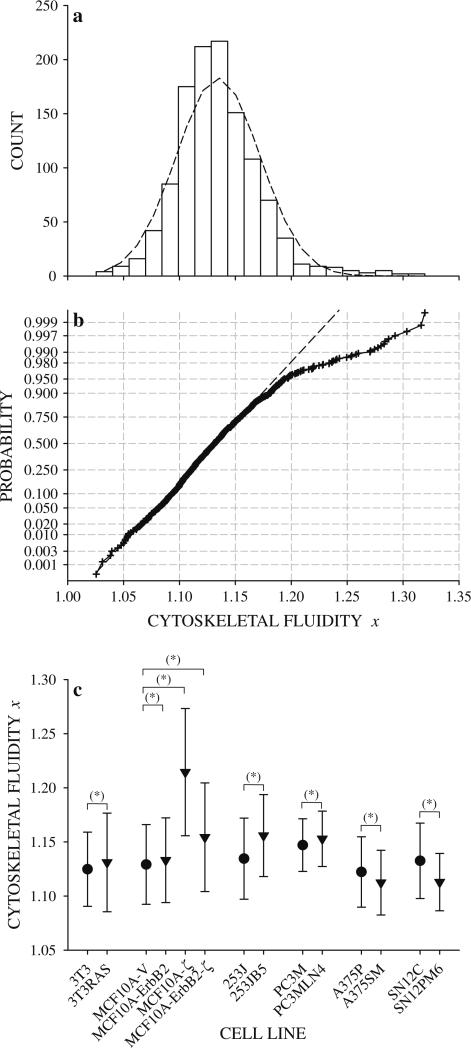
We quantified mechanical properties of cancer cells differing in metastatic potential. These cells included normal and H-ras-transformed NIH3T3 fibroblast cells, normal and oncoprotein-overexpressing MCF10A breast cancer cells, and weakly and strongly metastatic cancer cell line pairs originating from human cancers of the skin (A375P and A375SM cells), kidney (SN12C and SN12PM6 cells), prostate (PC3M and PC3MLN4 cells), and bladder (253J and 253JB5 cells). Using magnetic twisting cytometry, cytoskeletal stiffness (g') and internal friction (g″) were measured over a wide frequency range. The dependencies of g' and g″ upon frequency were used to determine the power law exponent x which is a direct measure of cytoskeletal fluidity and quantifies where the cytoskeleton resides along the spectrum of solid-like (x = 1) to fluid-like (x = 2) states. Cytoskeletal fluidity x increased following transformation by H-ras oncogene expression in NIH3T3 cells, overexpression of ErbB2 and 14-3-3-ζ in MCF10A cells, and implantation and growth of PC3M and 253J cells in the prostate and bladder, respectively. Each of these perturbations that had previously been shown to enhance cancer cell motility and invasion are shown here to shift the cytoskeleton towards a more fluid-like state. In contrast, strongly metastatic A375SM and SN12PM6 cells that disseminate by lodging in the microcirculation of peripheral organs had smaller x than did their weakly metastatic cell line pairs A375P and SN12C, respectively. Thus, enhanced hematological dissemination was associated with decreased x and a shift towards a more solid-like cytoskeleton. Taken together, these results are consistent with the notion that adaptations known to enhance metastatic ability in cancer cell lines define a spectrum of fluid-like versus solid-like states, and the position of the cancer cell within this spectrum may be a determinant of cancer progression.
Figures
Similar articles
-
Changes in cytoskeletal dynamics and nonlinear rheology with metastatic ability in cancer cell lines.Phys Biol. 2013 Dec;10(6):065001. doi: 10.1088/1478-3975/10/6/065001. Epub 2013 Dec 4. Phys Biol. 2013. PMID: 24304722
-
X-ray radiation promotes the metastatic potential of tongue squamous cell carcinoma cells via modulation of biomechanical and cytoskeletal properties.Hum Exp Toxicol. 2015 Sep;34(9):894-903. doi: 10.1177/0960327114561664. Epub 2015 Jan 13. Hum Exp Toxicol. 2015. PMID: 25586002
-
T24 HRAS transformed NIH/3T3 mouse cells (GhrasT-NIH/3T3) in serial tumorigenic in vitro/in vivo passages give rise to increasingly aggressive tumorigenic cell lines T1-A and T2-A and metastatic cell lines T3-HA and T4-PA.Exp Cell Res. 2016 Jan 1;340(1):1-11. doi: 10.1016/j.yexcr.2015.07.029. Epub 2015 Aug 5. Exp Cell Res. 2016. PMID: 26254261
-
Cell motility and cytoskeletal regulation in invasion and metastasis.J Mammary Gland Biol Neoplasia. 2007 Sep;12(2-3):143-52. doi: 10.1007/s10911-007-9046-4. J Mammary Gland Biol Neoplasia. 2007. PMID: 17557195 Review.
-
Cytoskeleton-associated proteins: their role as cellular integrators in the neoplastic process.Crit Rev Oncol Hematol. 1985;3(3):191-204. doi: 10.1016/s1040-8428(85)80026-3. Crit Rev Oncol Hematol. 1985. PMID: 2412718 Review.
Cited by
-
Adhesion strength and anti-tumor agents regulate vinculin of breast cancer cells.Front Oncol. 2022 Aug 16;12:811508. doi: 10.3389/fonc.2022.811508. eCollection 2022. Front Oncol. 2022. PMID: 36052248 Free PMC article.
-
Deformability of Tumor Cells versus Blood Cells.Sci Rep. 2015 Dec 18;5:18542. doi: 10.1038/srep18542. Sci Rep. 2015. PMID: 26679988 Free PMC article.
-
Characterization of biomechanical properties of cells through dielectrophoresis-based cell stretching and actin cytoskeleton modeling.Biomed Eng Online. 2017 Apr 4;16(1):41. doi: 10.1186/s12938-017-0329-8. Biomed Eng Online. 2017. PMID: 28376803 Free PMC article.
-
A novel cell-stiffness-fingerprinting analysis by scanning atomic force microscopy: comparison of fibroblasts and diverse cancer cell lines.Histochem Cell Biol. 2015 Dec;144(6):533-42. doi: 10.1007/s00418-015-1363-x. Epub 2015 Sep 10. Histochem Cell Biol. 2015. PMID: 26357955 Free PMC article.
-
MircroRNA Let-7a-5p in Airway Smooth Muscle Cells is Most Responsive to High Stretch in Association With Cell Mechanics Modulation.Front Physiol. 2022 Mar 25;13:830406. doi: 10.3389/fphys.2022.830406. eCollection 2022. Front Physiol. 2022. PMID: 35399286 Free PMC article.
References
-
- Sporn MB. The war on cancer. Lancet. 1996;347:1377–1381. - PubMed
-
- Chambers AF, Groom AC, MacDonald IC. Dissemination and growth of cancer cells in metastatic sites. Nat Rev Cancer. 2002;2:563–572. - PubMed
-
- Gupta GP, Massagué J. Cancer metastasis: building a framework. Cell. 2006;127:679–695. - PubMed
-
- Hanahan D, Weinberg RA. The hallmarks of cancer. Cell. 2000;100:57–70. - PubMed
-
- Perou CM, Sørlie T, Eisen MB, Rijn Mvd, Jeffrey SS, Rees CA, Pollack JR, Ross DT, Johnsen H, Akslen LA, Fluge Ø , Pergamenschikov A, Williams C, Zhu SX, Lønning PE, Børresen-Dale A-L, Brown PO, Botstein D. Molecular portraits of human breast tumors. Nature. 2000;406:747–752. - PubMed
Publication types
MeSH terms
Grants and funding
LinkOut - more resources
Full Text Sources
Research Materials
Miscellaneous
