. 2012 Oct;9(10):1005-12.
doi: 10.1038/nmeth.2171. Epub 2012 Sep 9.

Improving FRET dynamic range with bright green and red fluorescent proteins

Affiliations

Improving FRET dynamic range with bright green and red fluorescent proteins

Amy J Lam et al. Nat Methods. 2012 Oct.

Abstract

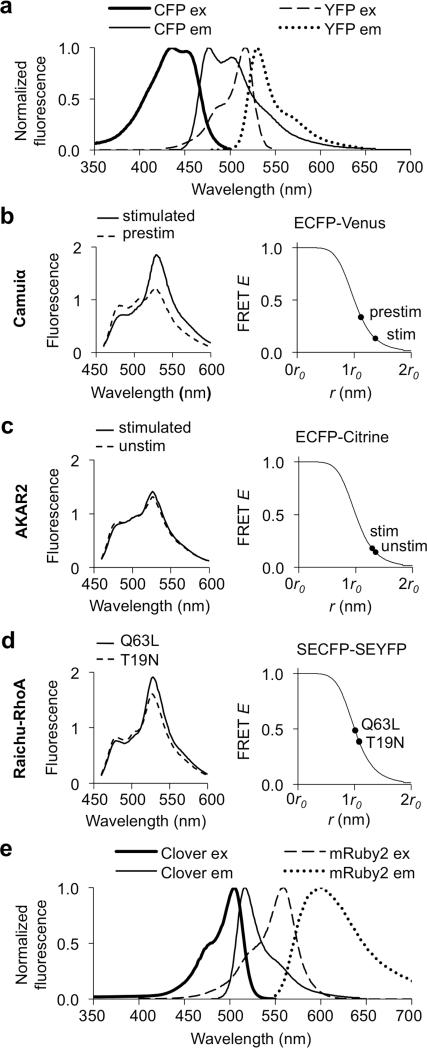
A variety of genetically encoded reporters use changes in fluorescence (or Förster) resonance energy transfer (FRET) to report on biochemical processes in living cells. The standard genetically encoded FRET pair consists of CFPs and YFPs, but many CFP-YFP reporters suffer from low FRET dynamic range, phototoxicity from the CFP excitation light and complex photokinetic events such as reversible photobleaching and photoconversion. We engineered two fluorescent proteins, Clover and mRuby2, which are the brightest green and red fluorescent proteins to date and have the highest Förster radius of any ratiometric FRET pair yet described. Replacement of CFP and YFP with these two proteins in reporters of kinase activity, small GTPase activity and transmembrane voltage significantly improves photostability, FRET dynamic range and emission ratio changes. These improvements enhance detection of transient biochemical events such as neuronal action-potential firing and RhoA activation in growth cones.


Figures

Figure 1
Figure 1
Assessment of FRET reporter performance using Förster equations and emission spectra. (a) Normalized spectra of ECFP and EYFP. Variants of CFP and YFP have identical spectra. (b-d) Modeling of existing FRET reporter performance using Förster equations and emission spectra. Ranges for the FRET efficiency E were derived by fitting theoretical to experimentally-obtained emission curves (left) and were then mapped to appropriate Förster E-r curves (right) for Camuiα (b), AKAR2 (c), or Raichu-RhoA (d). (e) Clover emission and mRuby2 excitation spectra show substantial overlap while Clover and mRuby2 emission spectra are better separated than CFP and YFP emission spectra.
Figure 2
Figure 2
Clover-mRuby2 improves responses versus ECFP-Venus in the CaMKIIα reporter Camuiα. (a) Organization of Camuiα-CR, based on Camuiα. (b) Intensity-modulated ratiometric images of HeLa cells expressing Camuiα-CR or Camuiα before and after addition of 1 μM ionomycin at time = 0. Scale bar, 20 μm. (c) Mean donor/acceptor emission ratio changes over time. Error bars represent standard error of the mean (s.e.m.). n = 10 cells for Camuiα, n = 12 cells for Camuiα-CR. Difference in peak emission ratio change is statistically significant (P = 7.6e–5). (d,e) Similar emission ratio responses were obtained with modified Camuiα-CR reporters where Clover was replaced with circularly permuted variants. Mean peak emission ratio changes with cpClover157 (n = 4 cells) and cpClover173 (n = 10 cells) were 31.8 ± 3.5% and 32.0 ± 2.2% (mean ± s.e.m.) respectively, not significantly different from Camuiα-CR (P = 0.52 and P = 0.3 respectively).
Figure 3
Figure 3
Clover-mRuby2 FRET in voltage sensing. (a) Organization of VSFP-CR, based on VSFP2.3. (b) Ratiometric images of hippocampal neurons expressing VSFP-CR before and after depolarization with 50 mM KCl. Increased acceptor/donor emission was observed at the cell membranes and in neurites (arrows), but not inside the cell body (asterisk). Scale bar, 10 μm. (c) For voltage-emission ratio relationships, hippocampal neurons expressing VSFP-CR were subjected to various voltage steps from a resting potential of –70mV by patch-clamping (top panel), and emission ratio changes at each voltage were measured (bottom panel). (d) Mean emission ratio changes in response to voltage steps for VSFP2.3 (n = 39 cells) or VSFP-CR (n = 47 cells). Error bars represent s.e.m. Differences at potentials ≤ –100 mV and ≥ –40 mV are statistically significant by two-tailed t-test with Bonferroni correction for 10 repeated measures (P = 6.9e–4, 1.9e–5, 1.9e–5, 3.3e–5, 1.8e–4, 1.2e–3, 4.7e–3, and 1.5e–3 for –120, –100, –40, – 20, 0, 20, 40, and 60 mV respectively, versus required P < 0.005 for α < 0.05). (e) Ratio changes in response to a single AP were 1.03 ± 0.1% (mean ± s.e.m., n = 22 cells) for VSFP-CR and 0.82 ± 0.05% (n = 32 cells) for VSFP2.3 (P = 0.04 by two-tailed t-test). (f) VSFP-CR ratio changes (bottom) reliably detected APs (top) in a single unfiltered trace with a measured peak/noise ratio of 8.0. Measured power at the specimen plane was 1 W cm-2. At this power, the baseline ratio changed by 5% over 25 s.
Figure 4
Figure 4
Reporting of fast local RhoA activation in neurons with Raichu-RhoA-CR. (a) Design of Raichu-RhoA-CR, based on Raichu-RhoA. (b) Ephrin-A stimulation locally activates RhoA in a hippocampal growth cone (asterisk) from the first time point after stimulation. Scale bar is 10 μm. (c) Raichu-RhoA-CR emission ratio graphed as mean ± s.e.m. (n = 5 cells). Peak ratio change (asterisk) was significantly different from baseline by two-tailed t-test (P = 0.0187). (d) With Raichu-RhoA, peak ratio change was not significantly different from baseline (P = 0.468, n = 8 cells).

References

    1. Reiff DF, et al. In vivo performance of genetically encoded indicators of neural activity in flies. J Neurosci. 2005;25:4766–4778. - PMC - PubMed
    1. Shaner NC, et al. Improving the photostability of bright monomeric orange and red fluorescent proteins. Nat Methods. 2008;5:545–551. - PMC - PubMed
    1. Sinnecker D, Voigt P, Hellwig N, Schaefer M. Reversible photobleaching of enhanced green fluorescent proteins. Biochemistry. 2005;44:7085–7094. - PubMed
    1. Raarup MK, et al. Enhanced yellow fluorescent protein photoconversion to a cyan fluorescent protein-like species is sensitive to thermal and diffusion conditions. J Biomed Opt. 2009;14:034039. - PubMed
    1. Malkani N, Schmid JA. Some secrets of fluorescent proteins: distinct bleaching in various mounting fluids and photoactivation of cyan fluorescent proteins at YFP-excitation. PLoS One. 2011;6:e18586. - PMC - PubMed

Publication types

MeSH terms

Substances

Associated data