Myocardial infarction differentially alters sphingolipid levels in plasma, erythrocytes and platelets of the rat
- PMID: 22961594
- PMCID: PMC3505520
- DOI: 10.1007/s00395-012-0294-0
Myocardial infarction differentially alters sphingolipid levels in plasma, erythrocytes and platelets of the rat
Abstract
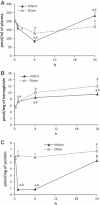
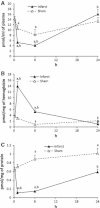
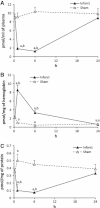
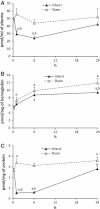
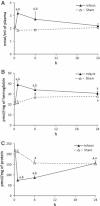
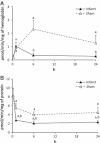
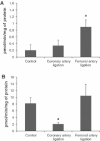
Three bioactive sphingolipids, namely sphingosine-1-phosphate (S1P), ceramide (CER) and sphingosine (SPH) were shown to be involved in ischemia/reperfusion injury of the heart. S1P is a powerful cardioprotectant, CER activates apoptosis and SPH in a low dose is cardioprotective whereas in a high dose is cardiotoxic. The aim of the present study was to examine effects of experimental myocardial infarction on the level of selected sphingolipids in plasma, erythrocytes and platelets in the rat. Myocardial infarction was produced in male Wistar rats by ligation of the left coronary artery. Blood was taken from the abdominal aorta at 1, 6 and 24 h after the ligation. Plasma, erythrocytes and platelets were isolated and S1P, dihydrosphingosine-1-phosphate (DHS1P), SPH, dihydrosphingosine (DHS) and CER were quantified by means of an Agilent 6460 triple quadrupole mass spectrometer using positive ion electrospray ionization source with multiple reaction monitoring. The infarction reduced the plasma level of S1P, DHS1P, SPH and DHS but increased the level of total CER. In erythrocytes, there was a sharp elevation in the level of SPH and DHS early after the infarction and a reduction after 24 h whereas the level of S1P, DHS1P and total CER gradually increased. In platelets, the level of each of the examined compounds profoundly decreased 1 and 6 h after the infarction and partially normalized in 24 h. The results obtained clearly show that experimental heart infarction in rats produces deep changes in metabolism of sphingolipids in the plasma, platelets and erythrocytes.
Figures



Similar articles
-
Distribution and dynamic changes of sphingolipids in blood in response to platelet activation.J Thromb Haemost. 2006 Dec;4(12):2704-9. doi: 10.1111/j.1538-7836.2006.02241.x. Epub 2006 Sep 28. J Thromb Haemost. 2006. PMID: 17010150
-
Myocardial infarction changes sphingolipid metabolism in the uninfarcted ventricular wall of the rat.Lipids. 2012 Sep;47(9):847-53. doi: 10.1007/s11745-012-3694-x. Epub 2012 Jul 26. Lipids. 2012. PMID: 22833182
-
Dose-dependent effect of aspirin on the level of sphingolipids in human blood.Adv Med Sci. 2013;58(2):274-81. doi: 10.2478/ams-2013-0021. Adv Med Sci. 2013. PMID: 24101372 Clinical Trial.
-
Sphingosine kinases, sphingosine 1-phosphate, apoptosis and diseases.Biochim Biophys Acta. 2006 Dec;1758(12):2016-26. doi: 10.1016/j.bbamem.2006.08.007. Epub 2006 Aug 18. Biochim Biophys Acta. 2006. PMID: 16996023 Review.
-
Metabolism and biological functions of two phosphorylated sphingolipids, sphingosine 1-phosphate and ceramide 1-phosphate.Prog Lipid Res. 2007 Mar;46(2):126-44. doi: 10.1016/j.plipres.2007.03.001. Epub 2007 Mar 14. Prog Lipid Res. 2007. PMID: 17449104 Review.
Cited by
-
Gene Expression Profiles Link Respiratory Viral Infection, Platelet Response to Aspirin, and Acute Myocardial Infarction.PLoS One. 2015 Jul 20;10(7):e0132259. doi: 10.1371/journal.pone.0132259. eCollection 2015. PLoS One. 2015. PMID: 26193668 Free PMC article.
-
Narrative review of metabolomics in cardiovascular disease.J Thorac Dis. 2021 Apr;13(4):2532-2550. doi: 10.21037/jtd-21-22. J Thorac Dis. 2021. PMID: 34012599 Free PMC article. Review.
-
Circulating Sphingolipids in Insulin Resistance, Diabetes and Associated Complications.Int J Mol Sci. 2023 Sep 13;24(18):14015. doi: 10.3390/ijms241814015. Int J Mol Sci. 2023. PMID: 37762318 Free PMC article. Review.
-
TIMP3 interplays with apelin to regulate cardiovascular metabolism in hypercholesterolemic mice.Mol Metab. 2015 Aug 6;4(10):741-52. doi: 10.1016/j.molmet.2015.07.007. eCollection 2015 Oct. Mol Metab. 2015. PMID: 26500845 Free PMC article.
-
Sphingolipids in the Heart: From Cradle to Grave.Front Endocrinol (Lausanne). 2020 Sep 15;11:652. doi: 10.3389/fendo.2020.00652. eCollection 2020. Front Endocrinol (Lausanne). 2020. PMID: 33042014 Free PMC article. Review.
References
-
- Ancellin N, Colmont C, Su J, Li Q, Mittereder N, Chae SS, Stefansson S, Liau G, Hla T. Extracellular export of sphingosine kinase-1 enzyme. Sphingosine 1-phosphate generation and the induction of angiogenic vascular maturation. J Biol Chem. 2002;277:6667–6675. doi: 10.1074/jbc.M102841200. - DOI - PubMed
-
- Beręsewicz A, Dobrzyń A, Górski J. Accumulation of specific ceramides in ischemic/reperfused ceramides; effect of ischemic preconditioning. J Physiol Pharmacol. 2002;53:371–382. - PubMed
Publication types
MeSH terms
Substances
LinkOut - more resources
Full Text Sources
Other Literature Sources
Medical

