. 2012 Nov;30(11):2366-77.
doi: 10.1002/stem.1219.

Histone deacetylase inhibitors stimulate dedifferentiation of human breast cancer cells through WNT/β-catenin signaling

Affiliations

Histone deacetylase inhibitors stimulate dedifferentiation of human breast cancer cells through WNT/β-catenin signaling

Bisrat G Debeb et al. Stem Cells. 2012 Nov.

Abstract

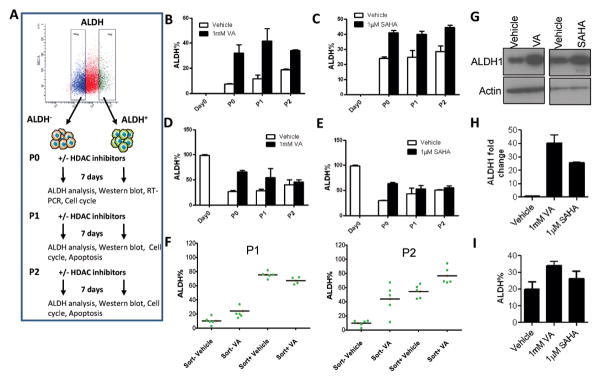
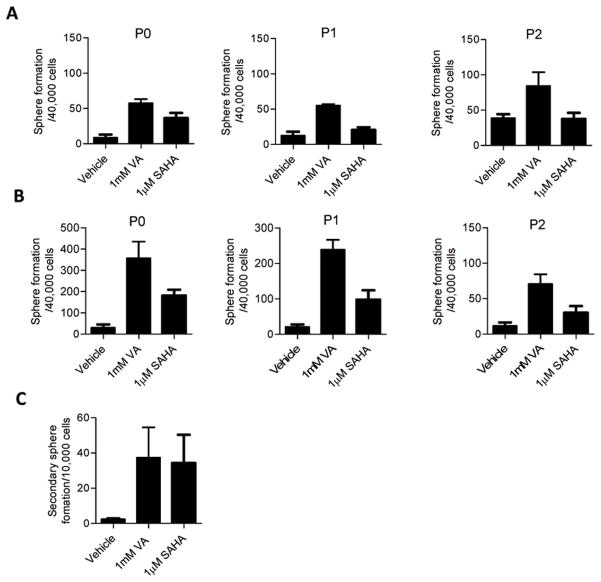
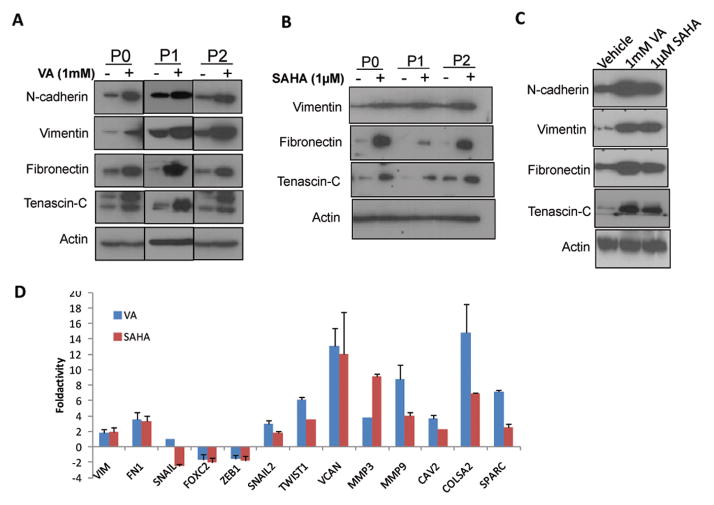
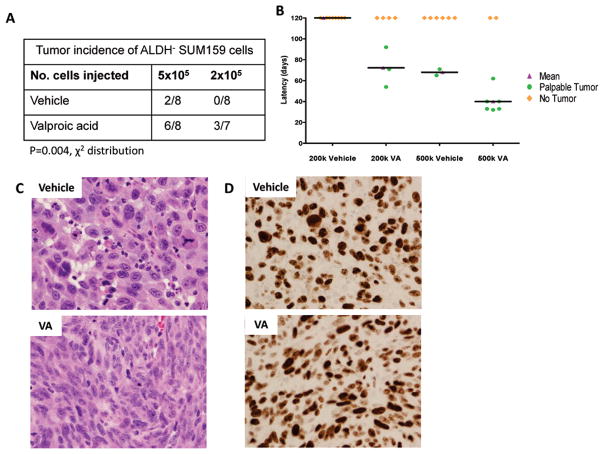
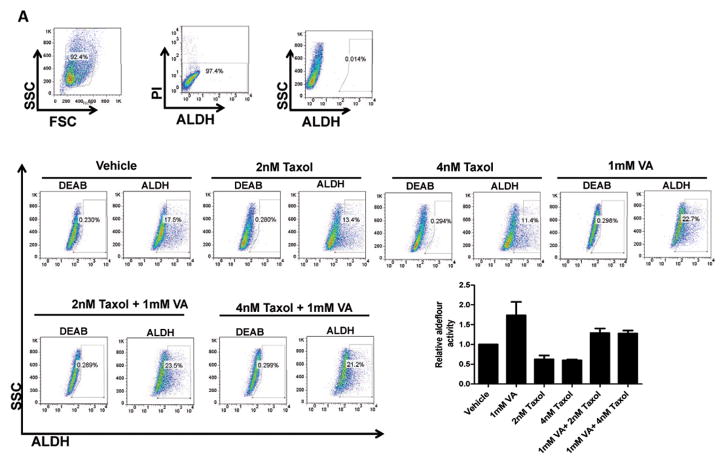
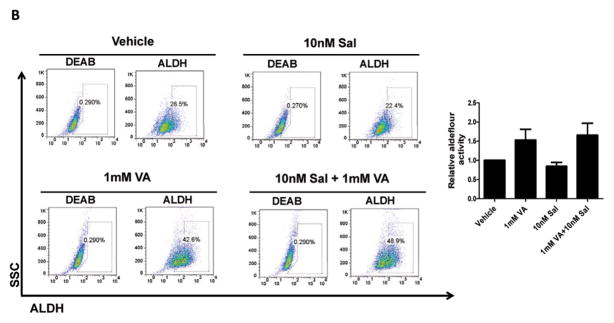
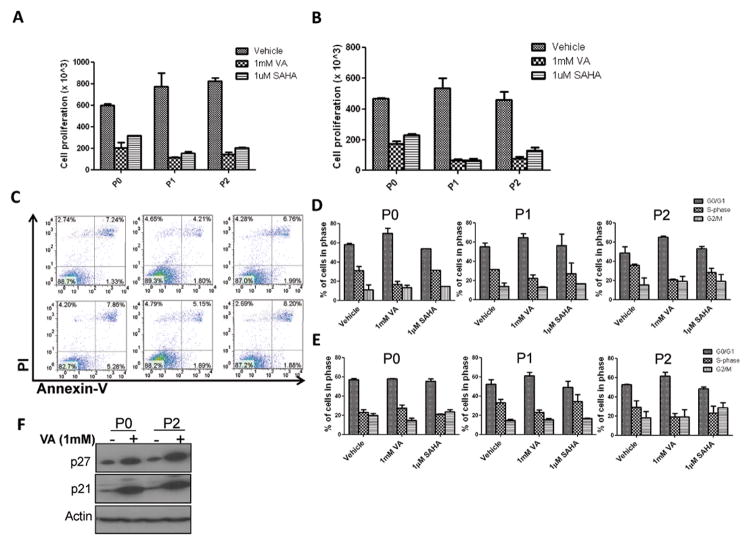
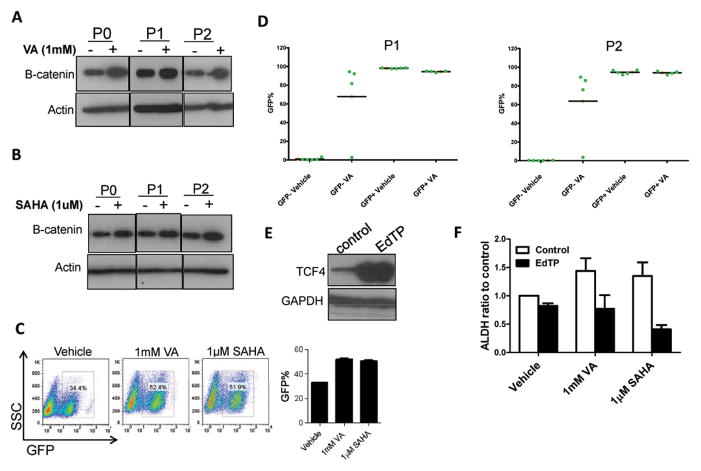
Recent studies have shown that differentiated cancer cells can dedifferentiate into cancer stem cells (CSCs) although to date no studies have reported whether this transition is influenced by systemic anti-cancer agents. Valproic acid (VA) is a histone deacetylase (HDAC) inhibitor that promotes self-renewal and expansion of hematopoietic stem cells and facilitates the generation of induced pluripotent stem cells from somatic cells and is currently being investigated in breast cancer clinical trials. We hypothesized that HDAC inhibitors reprogram differentiated cancer cells toward the more resistant stem cell-like state. Two highly aggressive breast cancer cell lines, SUM159 and MDA-231, were sorted based on aldehyde dehydrogenase (ALDH) activity and subsequently ALDH-negative and ALDH-positive cells were treated with one of two known HDAC inhibitors, VA or suberoylanilide hydroxamic acid. In addition, primary tumor cells from patients with metastatic breast cancer were evaluated for ALDH activity following treatment with HDAC inhibitors. We demonstrate that single-cell-sorted ALDH-negative cells spontaneously generated ALDH-positive cells in vitro. Treatment of ALDH-negative cells with HDAC inhibitors promoted the expansion of ALDH-positive cells and increased mammosphere-forming efficiency. Most importantly, it significantly increased the tumor-initiating capacity of ALDH-negative cells in limiting dilution outgrowth assays. Moreover, while HDAC inhibitors upregulated β-catenin expression and significantly increased WNT reporter activity, a TCF4 dominant negative construct abolished HDAC-inhibitor-induced expansion of CSCs. These results demonstrate that HDAC inhibitors promote the expansion of breast CSCs through dedifferentiation and have important clinical implications for the use of HDAC inhibitors in the treatment of cancer.


Conflict of interest statement

Conflict of Interest

The authors declare no conflict of interest.

Figures

Figure 1
Figure 1. HDAC inhibitors expand the CSC-like population
(A) Flow cytometry plot illustrating the gating strategy used to isolate subpopulations of SUM159 and MDA-231 cells based on ALDH activity as well as the generation of the different passages described in this paper. Gating is set to DEAB-inhibitor control cells. (B&C) Percentage of ALDH+ cells from SUM159 ALDH cells pre-treated for 7 days with either 1mM valproic acid (VA) or 1μM suberoylanilide hydroxamic acid (SAHA) or vehicle (DMSO). Results are mean ± SEM from at least 2 biological replicates. Variation in ALDH% was sometimes observed depending on culture conditions and the kit, but the proportional fold increase was similar in vehicle vs HDAC inhibitor-treated cells. (D&E) Percentage of ALDH+ cells generated from SUM159 sorted ALDH+ cells pretreated for 7 days with either 1mM valproic acid (VA) or 1μM suberoylanilide hydroxamic acid (SAHA) or vehicle (DMSO). Results are mean ± SEM from at least 2 biological replicates. (F) ALDH percentage in single cell derived clones from sorted ALDH or ALDH+ cells in the presence or absence of 1mM VA. (G) Immunoblot with anti-ALDH1 antibody in ALDH cells treated with 1mM VA, 1μM SAHA or vehicle control. (H) Quantitative RT- PCR of ALDH1 expression in the ALDH SUM159 cells treated with 1mM VA, 1μM SAHA or vehicle control. Data are represented as fold change relative to vehicle ± SEM. GAPDH was used as internal control. (I) Average percentage of ALDH+ cells in patient samples pre-treated with 1mM VA, 1μM SAHA or vehicle control. Results are mean ± SEM (N=3).
Figure 2
Figure 2. HDAC inhibitors markedly increase mammosphere formation in sorted ALDH cells
Primary mammosphere formation ability in (A) ALDH and (B) ALDH+ cells exposed to HDAC inhibitor treatment and seeded in self renewal promoting suspension culture conditions. There is an increase in mammosphere formation in the first and subsequent passages. (C) Secondary mammosphere formation was also increased in P0 ALDH cells treated with VA or SAHA. Mammosphere formation presented as the average number of spheres per 40,000 cells plated ± SEM; Representative data shown.
Figure 3
Figure 3. HDAC inhibitors increase the expression of EMT associated genes
Western blot showed upregulation of known EMT promoting proteins in ALDH cells treated for 7 days with or without (A) 1mM VA (B) 1 μM SAHA. E-cadherin was not detected. (C) ALDH+ cells also showed similar upregulation of EMT markers in all passages. P2 is shown. (D) Gene expression profile in ALDH P0 cells using the EMT PCR array.
Figure 4
Figure 4. HDAC inhibitors increase the tumor-initiating capacity of non-stem cells in limiting dilution outgrowth assays
(A) Tumor incidence in mouse xenografts injected with the indicated number of SUM159 ALDH P0 cells pretreated for 7 days with 1mM VA or vehicle. Cells were injected into the cleared mammary fat pad of SCID/Beige mice. (B) Tumor latency in groups described above. VA-treated cells had shorter xenograft tumor latency compared to control xenografts. (C) Representative Hematoxylin and Eosin stained sections of outgrowths obtained following injection of 5×10⁵ ALDH cells pre-treated with vehicle (top panel) or VA (bottom panel) into the cleared mammary fat pad of SCID/Beige mice. Vehicle pre-treated cells: invasive poorly differentiated tumor comprised of epitheliod cells exhibiting marked nuclear pleomorphism including few very large tumor cells. The tumor cells demonstrate large nucleolus, moderate amounts of cytoplasm and increased mitotic activity. Note the presence of abnormal mitotic figure in the tumor cell; VA pre-treated cells: Invasive poorly differentiated tumor comprised predominantly of spindle cells. The tumor cells demonstrate prominent nucleolus and moderate amount of cytoplasm. Note the scattered apoptotic bodies amidst the tumor cells. (D) KI67 labeling was noted in almost all the tumor cells indicating extremely high proliferative index.
Figure 5
Figure 5. HDAC inhibitors render breast cancer cells resistant to anti-cancer drugs
(A) ALDH percentage in P1 ALDH cells pretreated with vehicle, 1mM VA, 2nM and 4nM Taxol or a combination of VA and Taxol. A representative flow cytometry data is shown. Bar graph shows mean ± SEM of 4 biological replicates. (B) ALDH percentage in P3 ALDH cells pretreated with vehicle, 1mM VA, 10nM Salinomycin or a combination of VA and Salinomycin. A representative flow cytometry data is shown. Bar graph shows mean ± SEM of 3 biological replicates. Gating is set to DEAB-inhibitor control cells. A representative flow cytometry data is shown.
Figure 6
Figure 6. HDAC inhibitors reduce proliferation and the percentage of cycling cells
Cell proliferation assay conducted to assess proliferation rates in (A) ALDH or (B) ALDH+ cell population pre-treated for 7 days with 1mM VA or 1μM SAHA or vehicle control. (C) Assessment of apoptosis in ALDH and ALDH+ P0 SUM159 cells pretreated for 7 days with 1mM VA, 1μM SAHA or vehicle control. The induction of apoptosis was determined by flow cytometric analysis of Annexin V-FITC and PI-staining. Cells in the lower right quadrant indicate Annexin-positive, early apoptotic cells while cells in the upper right quadrant indicate Annexin-positive/PI-positive, late apoptotic cells. (D) ALDH and (E) ALDH+ SUM159 cells of multiple passages were profiled for their cell cycle pattern after they were pretreated with 1mM VA, 1μM SAHA or vehicle for 7 days. (F) Western blot analysis showed increased levels of cell cycle inhibitors p21 and p27 in VA-treated ALDH P0 cells.
Figure 7
Figure 7. HDAC inhibitors induce the β-catenin signaling pathway to increase CSC population
(A&B) Western blot analysis showed upregulation of β-catenin in SUM159 ALDH cells pretreated with 1mM VA, 1μM SAHA or vehicle for 7 days. (C) Percentage of GFP+ cells in SUM159 cells transfected with 7TGP, an eGFP expressing WNT activity reporter construct and treated with 1mM VA, 1μM SAHA or vehicle for 7 days. Bar graph shows mean ± SEM of 3 biological replicates. Untransfected cells served as controls. (D) WNT/beta-catenin reporter activity measured through GFP expression in single cell derived clones. GFP or GFP+ single cells were FACS deposited into each well in 24-well culture plate with or without 1mM VA, expanded and GFP percentage evaluated in randomly selected five clones from each group (P1). The same clones were passaged subsequently to obtain P2. (E) Western blot showing overexpressionn of TCF4 in SUM159 cells transfected with EdTP, a TCF4 dominant negative construct . (F) Flow cytometry analysis of ALDH activity indicates that SUM159 cells transfected with EdTP have reduced ALDH% and the expansion of the ALDH+ population was abolished in transfected cells treated with HDAC inhibitors. Bar graph shows the ALDH ratio to the control and is mean ± SEM of 3 biological replicates.

Similar articles

Cited by

References

    1. Al-Hajj M, Wicha MS, Benito-Hernandez A, et al. Prospective identification of tumorigenic breast cancer cells. Proc Natl Acad Sci U S A. 2003;100:3983–3988. - PMC - PubMed
    1. Ginestier C, Hur MH, Charafe-Jauffret E, et al. ALDH1 is a marker of normal and malignant human mammary stem cells and a predictor of poor clinical outcome. Cell Stem Cell. 2007;1:555–567. - PMC - PubMed
    1. Dontu G, Abdallah WM, Foley JM, et al. In vitro propagation and transcriptional profiling of human mammary stem/progenitor cells. Genes Dev. 2003;17:1253–1270. - PMC - PubMed
    1. Balic M, Lin H, Young L, et al. Most early disseminated cancer cells detected in bone marrow of breast cancer patients have a putative breast cancer stem cell phenotype. Clin Cancer Res. 2006;12:5615–5621. - PubMed
    1. Li F, Tiede B, Massague J, et al. Beyond tumorigenesis: cancer stem cells in metastasis. Cell Res. 2007;17:3–14. - PubMed

Publication types

MeSH terms