

doi: 10.1002/smll.201201549.
Epub 2012 Sep 7.
Colorimetric protein sensing using catalytically amplified sensor arrays
Affiliations
- PMID: 22961696
- PMCID: PMC3514658
- DOI: 10.1002/smll.201201549
Item in Clipboard
Colorimetric protein sensing using catalytically amplified sensor arrays
Small.
.
Abstract
Catalytically active iron oxide nanoparticles are used as recognition elements and signal amplifiers for the array-based colorimetric sensing of proteins. Interactions between cationic monolayers on the Fe(3) O(4) NPs and analyte proteins differentially modulates the peroxidase-like activity of Fe(3) O(4) NPs, affording catalytically amplified colorimetric signal patterns that enable the detection and identification of proteins at 50 nM.
Copyright © 2012 WILEY-VCH Verlag GmbH & Co. KGaA, Weinheim.
Figures
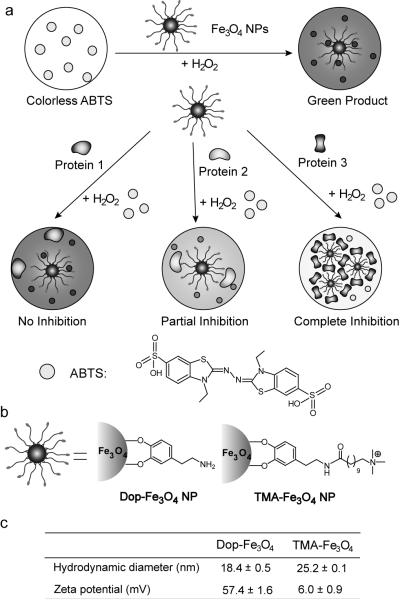
a. Illustration of the Fe3O4 NP enzyme mimetic amplified colorimetric sensing of proteins. b. Structures of Dop-Fe3O4 and TMA-Fe3O4. c. Hydrodynamic diameter and zeta potential of Fe3O4 NPs in 5 mM CH3COONa buffer at pH 5.0.
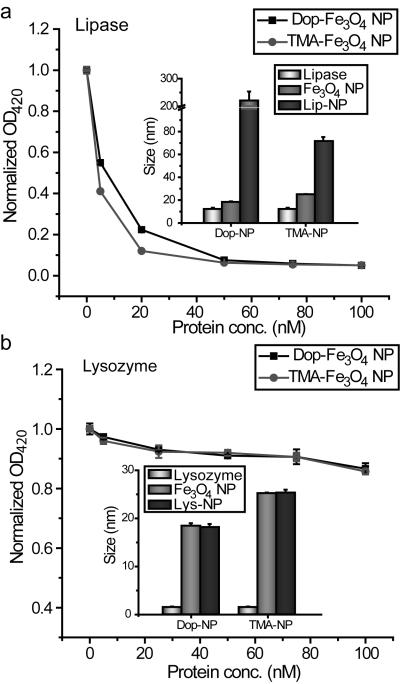
Normalized OD at 420 nm upon protein addition with fixed NPs concentration (25 μg/mL). a. Concentration dependent OD curve of lipase. Inset is the hydrodynamic diameter of functionalized Fe3O4 NPs and lipase-NP complexes. b. Normalized OD curve of lysozyme with modest permutation. Inset: hydrodynamic diameter of functionalized Fe3O4 NPs and lysozyme-NP complexes. Results are average of three measurements and error bars are standard deviation. The NP concentration used in the size measurement is 250 μg/mL and the protein is at a concentration of 500 nM.
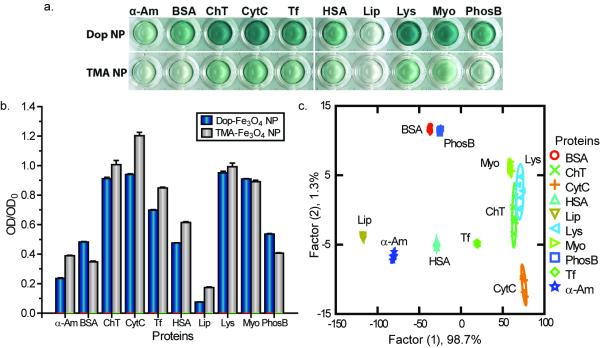
Array-based sensing of ten proteins. a. Photograph of the color change upon addition of protein solutions at 50 nM. b. OD response (OD/OD0 at 420 nm) patterns in the presence of proteins at 50 nM (responses are an average of five measurements and the error bars are the standard deviation). c. Canonical score plot for the OD response patterns as obtained from LDA with 95% confidence ellipses.
References
-
- Mullenix MC, Wiltshire S, Shao WP, Kitos G, Schweitzer B. Clin. Chem. 2001;47:1926–1929.
-
- Kingsmore SF, Patel DD. Curr. Opin. Biotechnol. 2003;14:74–81. - PubMed
-
- Okuno J, Maehashi K, Kerman K, Takamura Y, Matsumoto K, Tamiya E. Biosens. Bioelectron. 2007;22:2377–2381. - PubMed
-
- Anderson NL, Anderson NG. Mol. Cell. Proteomics. 2002;1:845–867. - PubMed
-
- Hartwell L, Mankoff D, Paulovich A, Ramsey S, Swisher E. Nat. Biotechnol. 2006;24:905–908. - PubMed
Publication types
MeSH terms
Substances
Grants and funding
LinkOut - more resources
Full Text Sources
