

Serial measurement of hepatic lipids during chemotherapy in patients with colorectal cancer: a 1 H MRS study
- PMID: 22961714
- PMCID: PMC3519948
- DOI: 10.1002/nbm.2837
Serial measurement of hepatic lipids during chemotherapy in patients with colorectal cancer: a 1 H MRS study
Erratum in
- NMR Biomed. 2014 Feb;27(2):235. Jarnagin, William M [corrected to Jarnagin, William R]
Abstract
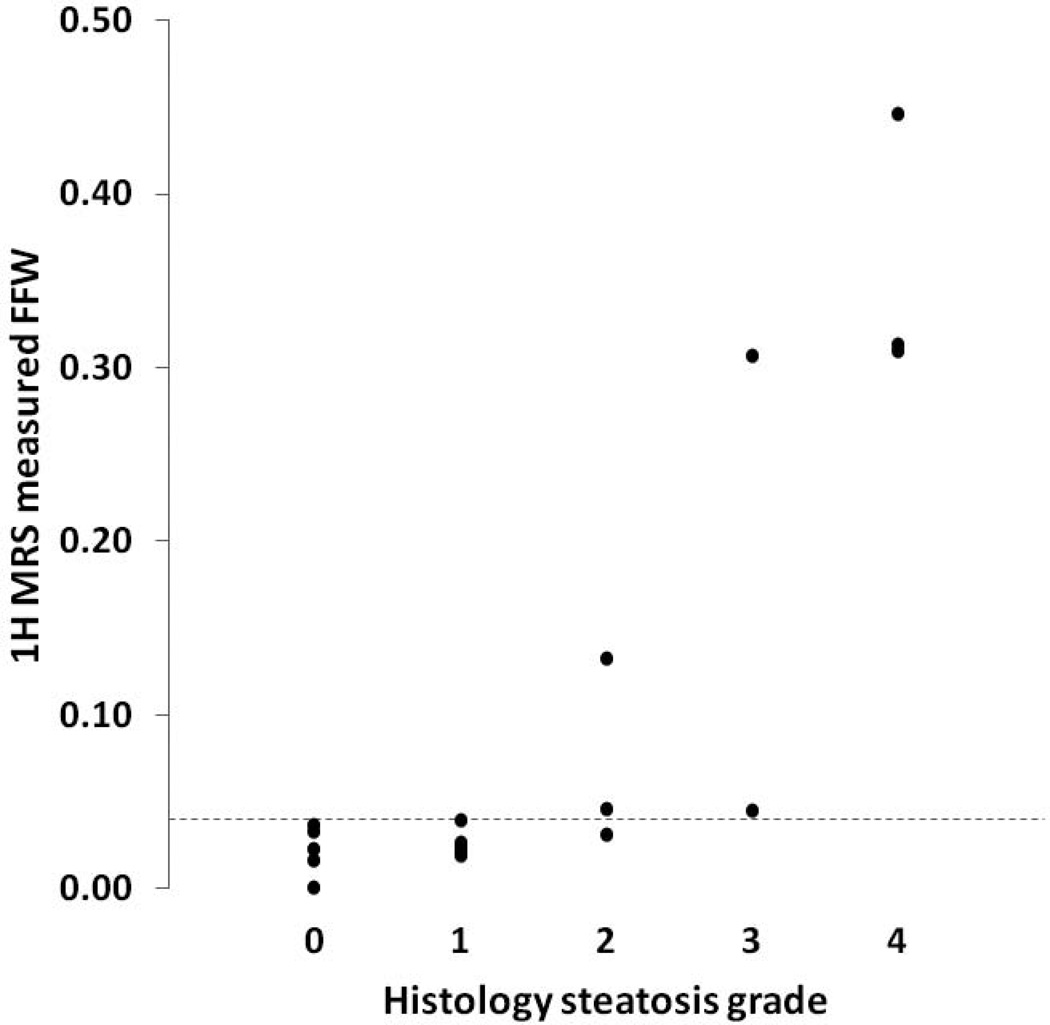
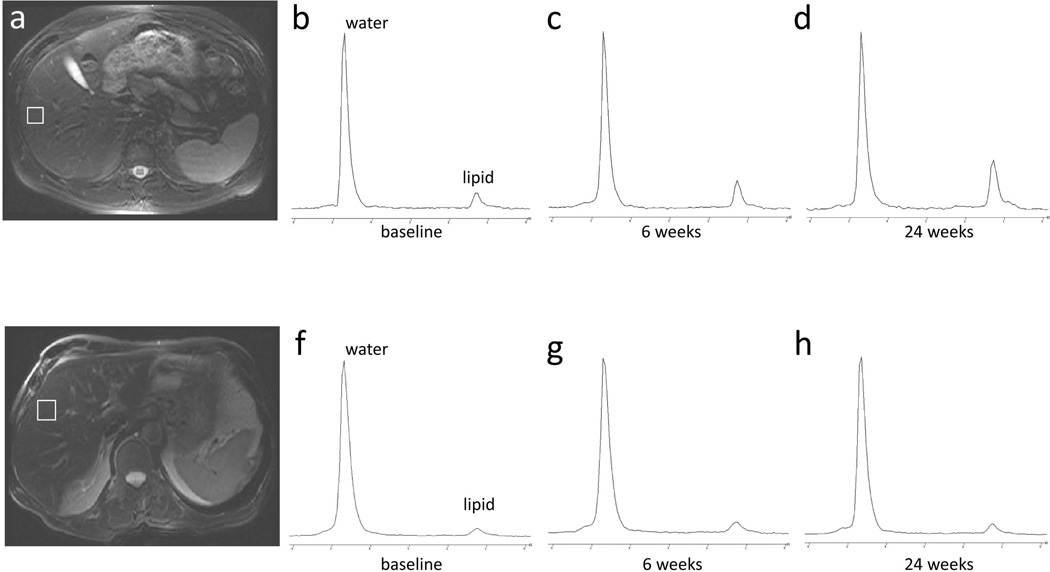
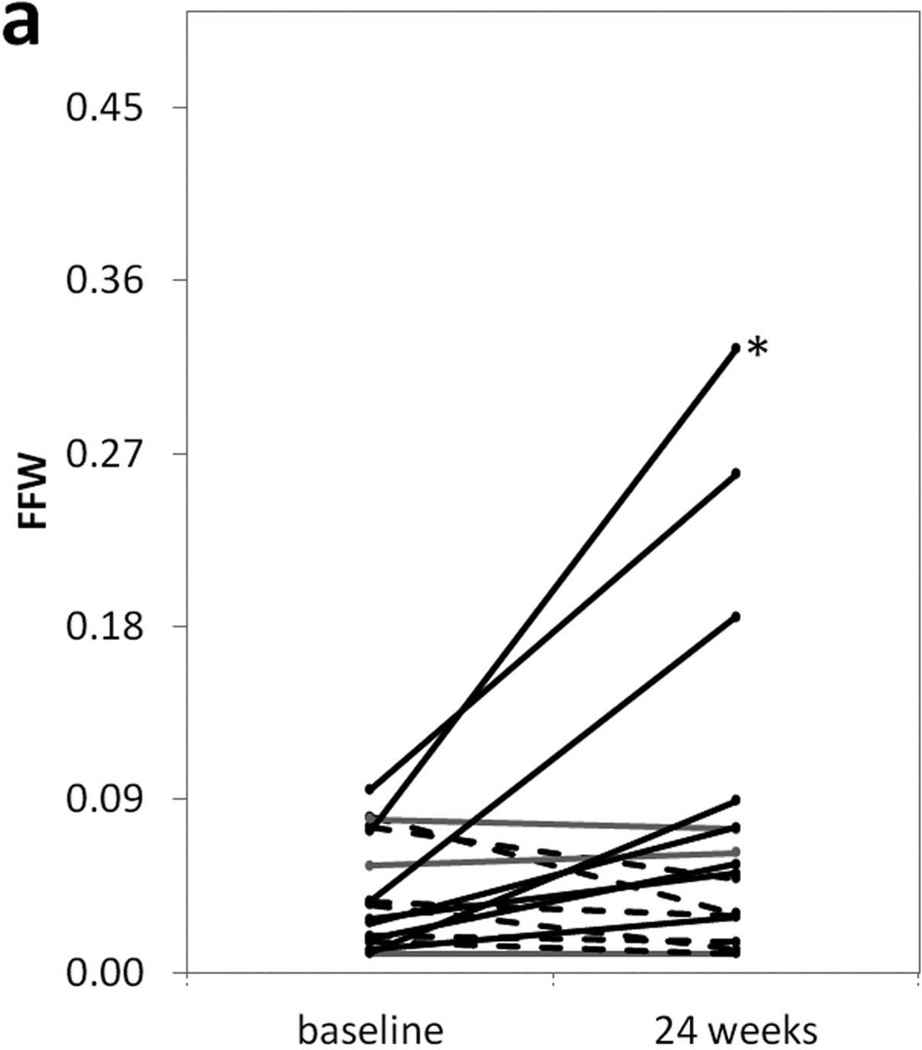
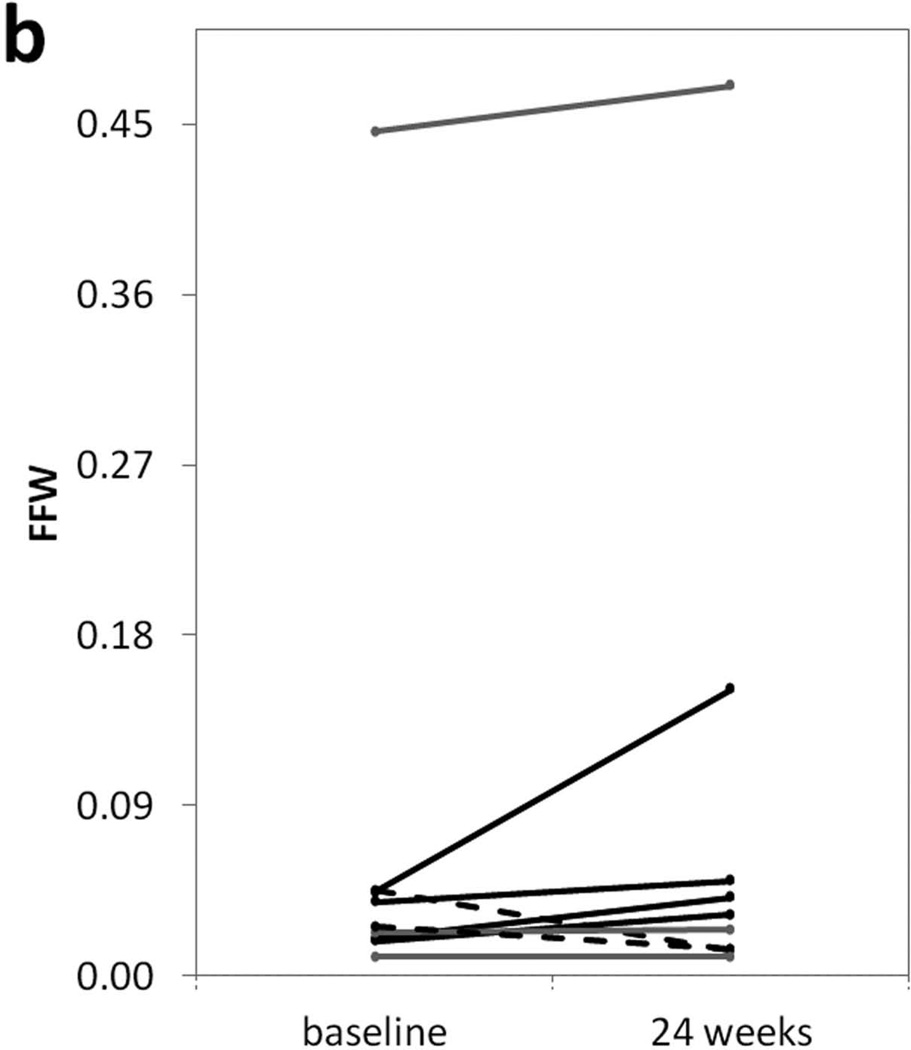
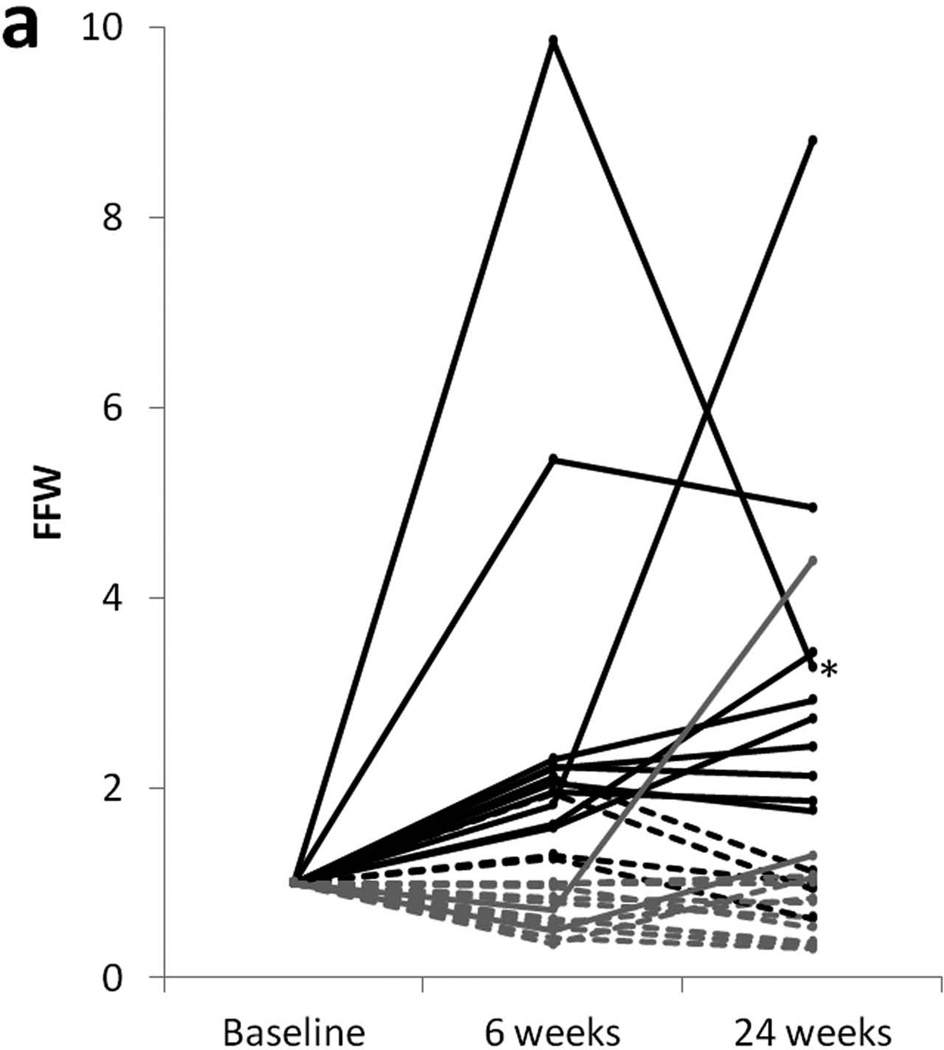
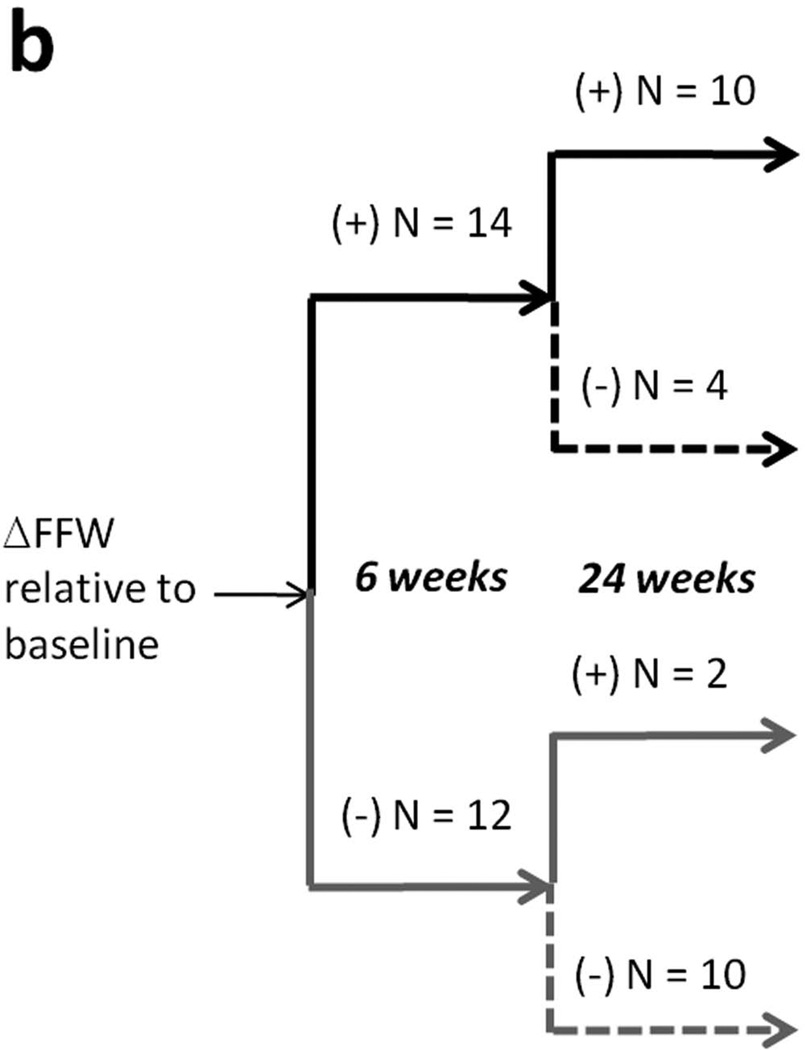
Hepatic steatosis is a hallmark of chemotherapy-induced liver injury. We made serial (1) H MRS measurements of hepatic lipids in patients over the time course of a 24-week chemotherapeutic regimen to determine whether (1) H MRS could be used to monitor the progression of chemotherapy-induced steatosis. Thirty-four patients with stage III or IV colorectal cancer receiving 5-fluorouracil, folinic acid and oxaliplatin (n=21) or hepatic arterial infusion of floxuridine with systemic irinotecan (n=13) were studied prospectively. (1) H MRS studies were performed at baseline and after 6 and 24 weeks of treatment. A (1) H MR spectrum was acquired from the liver during a breath hold and the ratio of fat to fat+water (FFW) was calculated to give a measure of hepatic triglycerides (HTGCs). The methodology was histologically validated in 18 patients and the reproducibility was assessed in 16 normal volunteers. Twenty-seven patients completed baseline, 6-week and 24-week (1) H MRS examinations and one was censored. Thirteen of 26 patients (50%) showed an increase in FFW after completion of treatment. Six patients (23%) developed hepatic steatosis and two patients converted from steatosis to nonsteatotic liver. Patients whose 6-week hepatic lipid levels had increased significantly relative to baseline also had a high probability of lipid elevation relative to baseline at the completion of treatment. Serial (1) H MRS is effective for the monitoring of HTGC changes during chemotherapy and for the detection of chemotherapy-associated steatosis. Six of 26 patients developed steatosis during chemotherapy. Lipid changes were observable at 6 weeks.
Copyright © 2012 John Wiley & Sons, Ltd.
Figures
Similar articles
-
Hepatic lipid composition analysis using 3.0-T MR spectroscopy in a steatotic rat model.Magn Reson Imaging. 2012 Jan;30(1):112-21. doi: 10.1016/j.mri.2011.07.028. Epub 2011 Sep 21. Magn Reson Imaging. 2012. PMID: 21940131
-
Alterations in hepatic fatty acids reveal depletion of total polyunsaturated fatty acids following irinotecan plus 5-fluorouracil treatment in an animal model of colorectal cancer.Prostaglandins Leukot Essent Fatty Acids. 2021 Nov;174:102359. doi: 10.1016/j.plefa.2021.102359. Epub 2021 Nov 1. Prostaglandins Leukot Essent Fatty Acids. 2021. PMID: 34740033
-
Hydrogen-1 MR spectroscopy for measurement and diagnosis of hepatic steatosis.AJR Am J Roentgenol. 2012 Jul;199(1):2-7. doi: 10.2214/AJR.11.7384. AJR Am J Roentgenol. 2012. PMID: 22733887 Free PMC article. Clinical Trial.
-
Patterns of chemotherapy-induced hepatic injury and their implications for patients undergoing liver resection for colorectal liver metastases.J Hepatobiliary Pancreat Surg. 2009;16(2):137-44. doi: 10.1007/s00534-008-0016-z. Epub 2008 Dec 18. J Hepatobiliary Pancreat Surg. 2009. PMID: 19093069 Review.
-
Basic research supported developments of chemotherapy in nonresectable isolated colorectal liver metastases to a protocol of hepatic artery infusion using mitoxantrone, 5-FU + folinic acid and mitomycin C.Gan To Kagaku Ryoho. 1999 Feb;26(3):269-81. Gan To Kagaku Ryoho. 1999. PMID: 10065089 Review.
References
-
- Saltz LB, Cox JV, Blanke C, Rosen LS, Fehrenbacher L, Moore MJ, Maroun JA, Ackland SP, Locker PK, Pirotta N, Elfring GL, Miller LL. Irinotecan plus fluorouracil and leucovorin for metastatic colorectal cancer. Irinotecan Study Group. N Engl J Med. 2000;343:905–914. - PubMed
-
- Goldberg RM, Sargent DJ, Morton RF, Fuchs CS, Ramanathan RK, Williamson SK, Findlay BP, Pitot HC, Alberts SR. A randomized controlled trial of fluorouracil plus leucovorin, irinotecan, and oxaliplatin combinations in patients with previously untreated metastatic colorectal cancer. J Clin Oncol. 2004;22:23–30. - PubMed
-
- Adam R, Delvart V, Pascal G, Valeanu A, Castaing D, Azoulay D, Giacchetti S, Paule B, Kunstlinger F, Ghemard O, Levi F, Bismuth H. Rescue surgery for unresectable colorectal liver metastases downstaged by chemotherapy: a model to predict long-term survival. Ann Surg. 2004;240:644–657. discussion 657–648. - PMC - PubMed
-
- Fernandez FG, Ritter J, Goodwin JW, Linehan DC, Hawkins WG, Strasberg SM. Effect of steatohepatitis associated with irinotecan or oxaliplatin pretreatment on resectability of hepatic colorectal metastases. J Am Coll Surg. 2005;200:845–853. - PubMed
-
- Cleary JM, Tanabe KT, Lauwers GY, Zhu AX. Hepatic toxicities associated with the use of preoperative systemic therapy in patients with metastatic colorectal adenocarcinoma to the liver. Oncologist. 2009;14:1095–1105. - PubMed
Publication types
MeSH terms
Substances
Grants and funding
LinkOut - more resources
Full Text Sources
Medical
