

ROCK1 inhibition promotes the self-renewal of a novel mouse mammary cancer stem cell
- PMID: 22961723
- PMCID: PMC3967738
- DOI: 10.1002/stem.1224
ROCK1 inhibition promotes the self-renewal of a novel mouse mammary cancer stem cell
Abstract
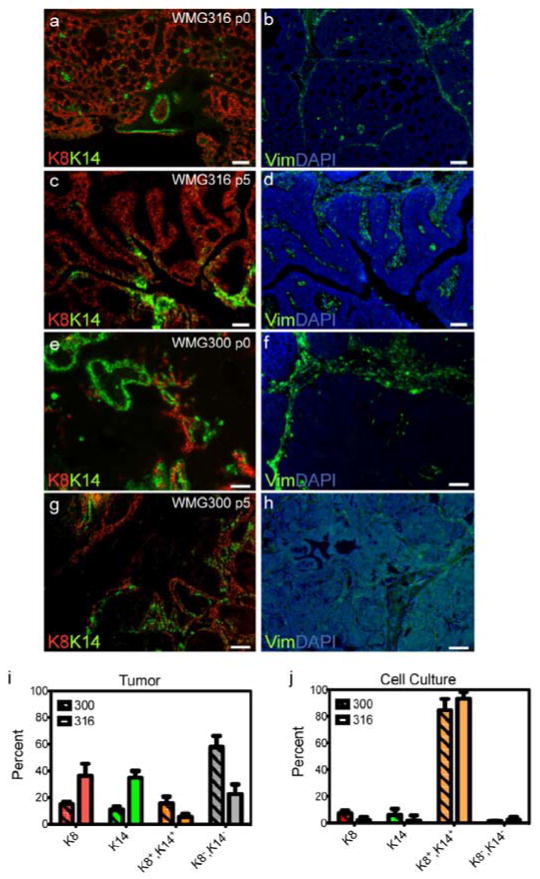
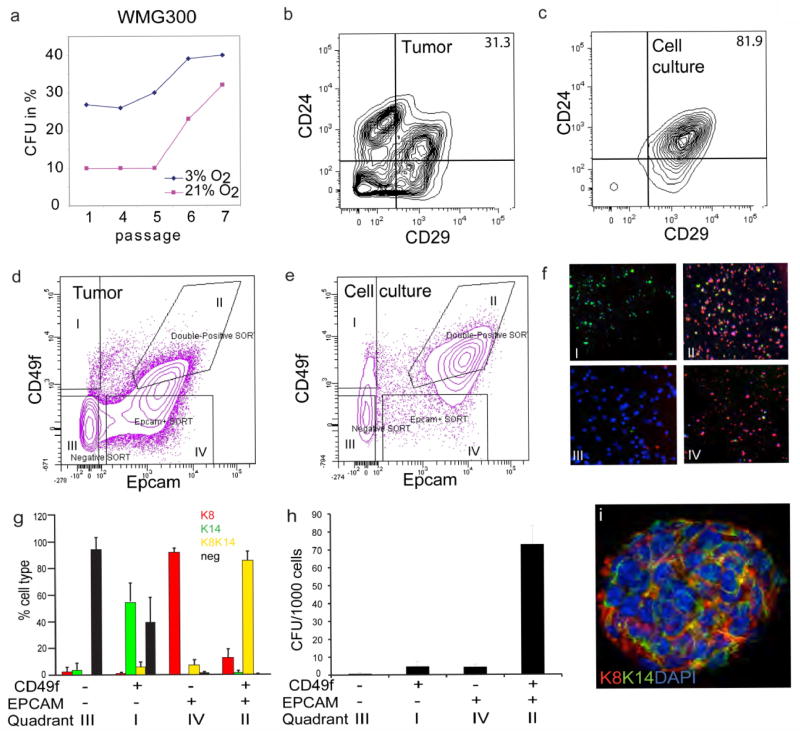
The differentiation of stem-like tumor cells may contribute to the cellular heterogeneity of breast cancers. We report the propagation of highly enriched mouse mammary cancer stem cells that retain the potential to differentiate both in vivo and in culture and their use to identify chemical compounds that influence both self-renewal and differentiation. We identify epithelial tumor-initiating cells (ETICs) that express lineage markers of both basal and luminal mammary cell lineages and retain the potential, from even single cells, to generate heterogeneous tumors similar to the tumor of origin. ETICs can progress through a Rho-associated coiled-coil containing protein kinase 1 dependent, epithelial to mesenchymal transition to generate mesenchymal tumor-initiating cells capable of initiating tumors of limited heterogeneity. The propagation of ETICs may allow for the identification of new therapeutic compounds that may inhibit or prevent progression of some types of breast cancer.
Copyright © 2012 AlphaMed Press.
Conflict of interest statement
Conflicts of Interest: The authors declare no potential conflicts of interest.
Figures


Similar articles
-
Chromatin effector Pygo2 regulates mammary tumor initiation and heterogeneity in MMTV-Wnt1 mice.Oncogene. 2014 Jan 30;33(5):632-42. doi: 10.1038/onc.2012.620. Epub 2013 Jan 21. Oncogene. 2014. PMID: 23334328 Free PMC article.
-
Differentiation generates paracrine cell pairs that maintain basaloid mouse mammary tumors: proof of concept.PLoS One. 2011 Apr 26;6(4):e19310. doi: 10.1371/journal.pone.0019310. PLoS One. 2011. PMID: 21541292 Free PMC article.
-
Cooperative signaling between Wnt1 and integrin-linked kinase induces accelerated breast tumor development.Breast Cancer Res. 2010;12(3):R38. doi: 10.1186/bcr2592. Epub 2010 Jun 21. Breast Cancer Res. 2010. PMID: 20565980 Free PMC article.
-
Stem cells and mammary cancer in mice.Stem Cell Rev. 2005;1(3):215-23. doi: 10.1385/SCR:1:3:215. Stem Cell Rev. 2005. PMID: 17142858 Review.
-
The emerging picture of the mouse mammary stem cell.Stem Cell Rev. 2007 Jun;3(2):114-23. doi: 10.1007/s12015-007-0018-2. Stem Cell Rev. 2007. PMID: 17873344 Review.
Cited by
-
Spheroid culture of LuCaP 147 as an authentic preclinical model of prostate cancer subtype with SPOP mutation and hypermutator phenotype.Cancer Lett. 2014 Sep 1;351(2):272-80. doi: 10.1016/j.canlet.2014.06.014. Epub 2014 Jul 3. Cancer Lett. 2014. PMID: 24998678 Free PMC article.
-
RhoGDIα suppresses self-renewal and tumorigenesis of glioma stem cells.Oncotarget. 2016 Sep 20;7(38):61619-61629. doi: 10.18632/oncotarget.11423. Oncotarget. 2016. PMID: 27557508 Free PMC article.
-
Cell Cytoskeleton and Stiffness Are Mechanical Indicators of Organotropism in Breast Cancer.Biology (Basel). 2021 Mar 25;10(4):259. doi: 10.3390/biology10040259. Biology (Basel). 2021. PMID: 33805866 Free PMC article.
-
Targeting the cytoskeleton against metastatic dissemination.Cancer Metastasis Rev. 2021 Mar;40(1):89-140. doi: 10.1007/s10555-020-09936-0. Epub 2021 Jan 20. Cancer Metastasis Rev. 2021. PMID: 33471283 Review.
-
Premetastatic niche mechanics and organotropism in breast cancer.NPJ Biol Phys Mech. 2025;2(1):11. doi: 10.1038/s44341-025-00015-5. Epub 2025 Apr 3. NPJ Biol Phys Mech. 2025. PMID: 40191104 Free PMC article. Review.
References
-
- Clarke MF, Dick JE, Dirks PB, et al. Cancer stem cells--perspectives on current status and future directions: AACR Workshop on cancer stem cells. Cancer Res. 2006;66:9339–9344. - PubMed
-
- Cho RW, Wang X, Diehn M, et al. Isolation and molecular characterization of cancer stem cells in MMTV-Wnt-1 murine breast tumors. Stem Cells. 2008;26:364–371. - PubMed
-
- Vaillant F, Asselin-Labat ML, Shackleton M, et al. The mammary progenitor marker CD61/beta3 integrin identifies cancer stem cells in mouse models of mammary tumorigenesis. Cancer Res. 2008;68:7711–7717. - PubMed
Publication types
MeSH terms
Substances
Grants and funding
LinkOut - more resources
Full Text Sources
Other Literature Sources
Molecular Biology Databases
Research Materials
