. 2012 Oct 26;287(44):36777-91.
doi: 10.1074/jbc.M112.372557. Epub 2012 Sep 7.

Induction of cancerous stem cells during embryonic stem cell differentiation

Affiliations

Induction of cancerous stem cells during embryonic stem cell differentiation

Hiroaki Fujimori et al. J Biol Chem. .

Abstract

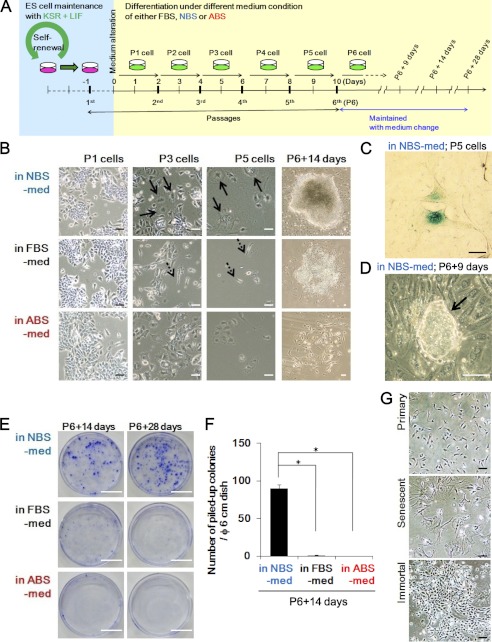
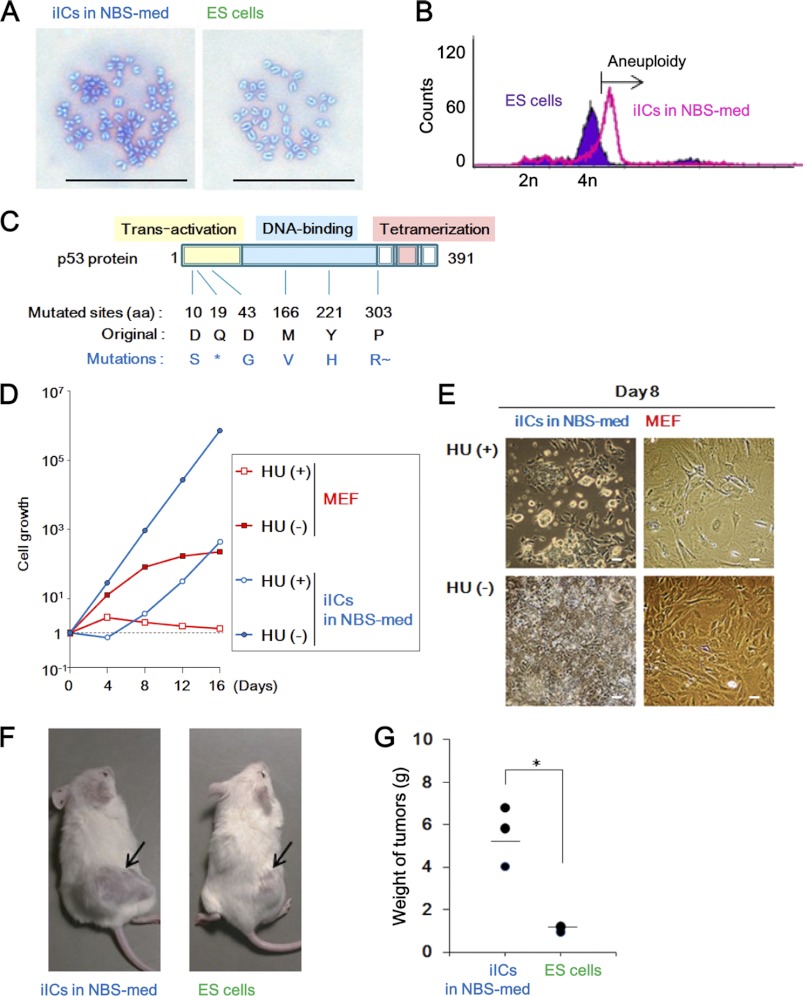
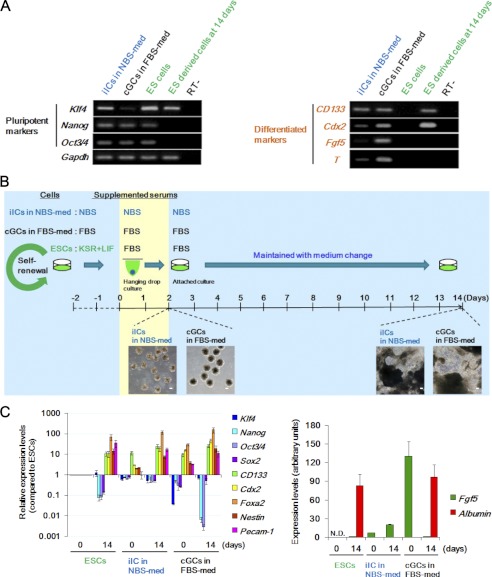
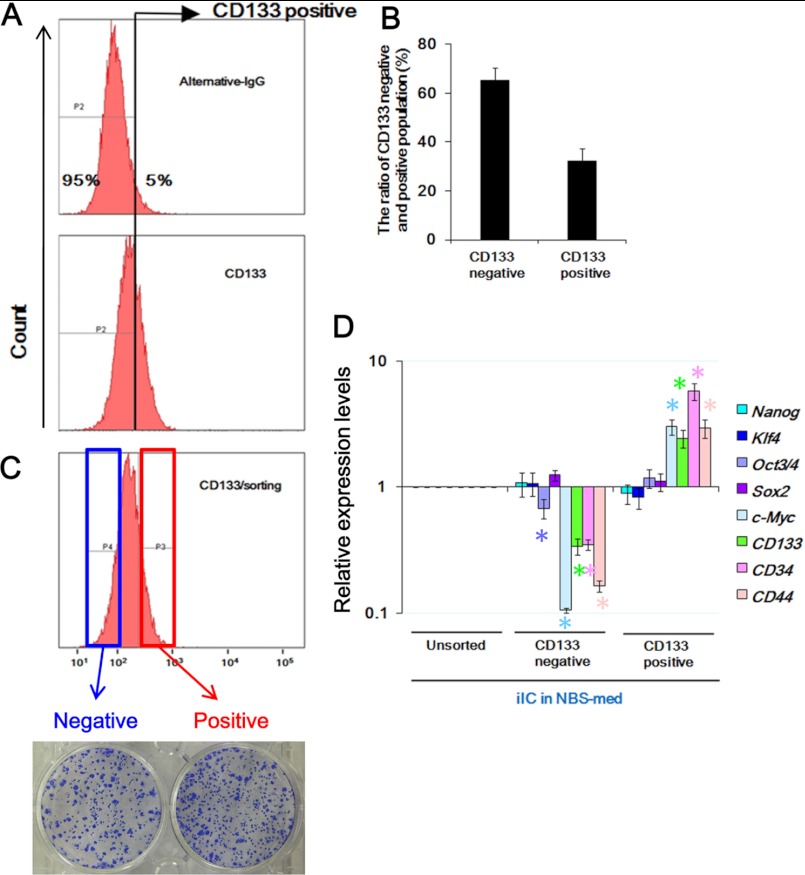
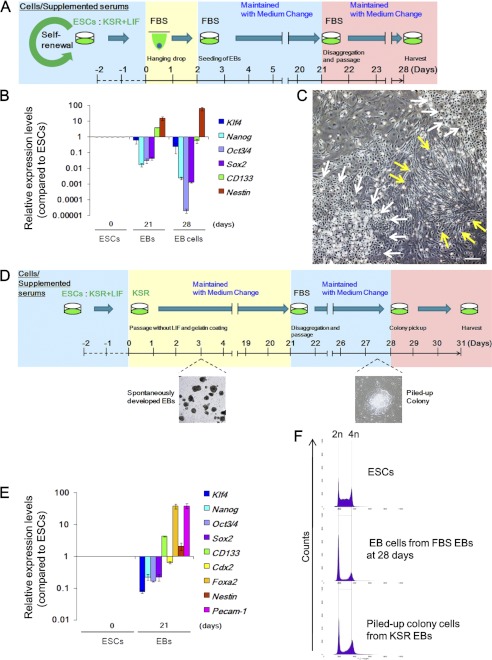
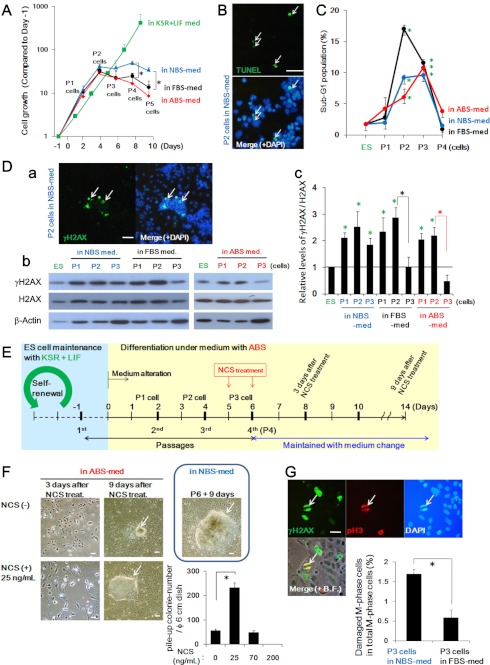
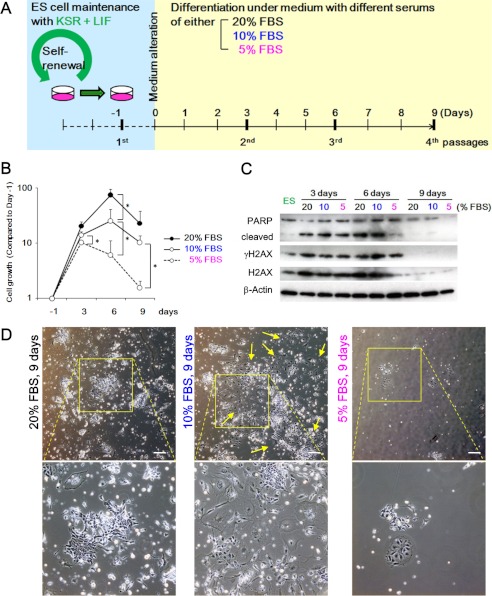
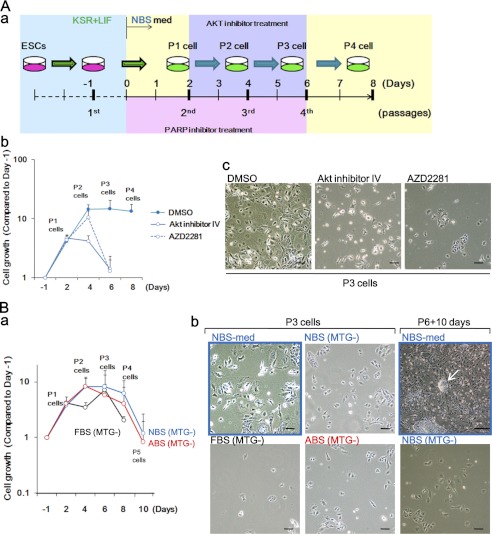
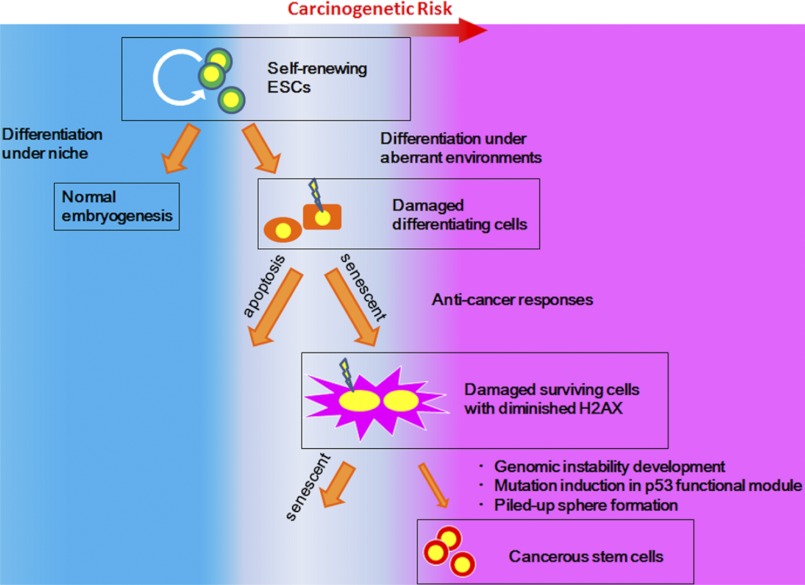
Stem cell maintenance depends on their surrounding microenvironment, and aberrancies in the environment have been associated with tumorigenesis. However, it remains to be elucidated whether an environmental aberrancy can act as a carcinogenic stress for cellular transformation of differentiating stem cells into cancer stem cells. Here, utilizing mouse embryonic stem cells as a model, it was illustrated that environmental aberrancy during differentiation leads to the emergence of pluripotent cells showing cancerous characteristics. Analogous to precancerous stages, DNA lesions were spontaneously accumulated during embryonic stem cell differentiation under aberrational environments, which activates barrier responses such as senescence and apoptosis. However, overwhelming such barrier responses, piled-up spheres were subsequently induced from the previously senescent cells. The sphere cells exhibit aneuploidy and dysfunction of the Arf-p53 module as well as enhanced tumorigenicity and a strong self-renewal capacity, suggesting development of cancerous stem cells. Our current study suggests that stem cells differentiating in an aberrational environment are at risk of cellular transformation into malignant counterparts.


Figures

FIGURE 1.
FIGURE 1.
ESCs differentiating in NBS-med undergo senescence and subsequently aggregate in piled-up spheres. A, an experimental design is shown. ESCs maintained with passaging every 2 days were held under three serum conditions. Cells were passaged as per ESC cultivation in each medium condition until passage 6 followed by continued maintenance with medium change. B–D, shown is piled-up sphere development via senescence. Representative images during differentiation induction in each condition are shown. After serial cell proliferation, cells in NBS-med senesced as indicated by the flattened and enlarged morphology (B; arrows) and β-galactosidase activity (C), which led to the development of piled-up colonies (representative image) (D). Cells in FBS-med did not show massive senescence (B; arrows with dotted line). ABS conditions did not induce subsequent proliferating cells (B, P6 + 14 days). E and F, piled-up sphere formation in each medium condition is shown. Although massive sphere development was observed in NBS-med, it was rarely observed in the other conditions. G, shown are normal MEFs senesced after serial proliferation, similar to the process seen during the differentiation of ESCs. Scale bars, 50 μm (B–D and G) or 2 cm (E).
FIGURE 2.
FIGURE 2.
iICs in NBS-med show cancerous characteristics. A and B, aneuploidy is observed in iICs in NBS-med by Giemsa staining (A) and DNA content analysis (B) of M-phase cells. C, mutated p53 is frequently detected in iICs in NBS-med. The asterisk (*) indicates the stop codon. R∼ indicates the resulting frameshift. aa, amino acids. D and E, the iICs in NBS-med show defective p53-dependent growth repression after treatment with low dose HU (0.2 mm). Growth curve (D) and morphology (E) are shown. F and G, enhanced tumorigenicity was observed in the iICs in NBS-med. Arrows indicate tumors (F) induced in NOD-SCID mice after transplantation. Tumor weights were measured 4 weeks after transplantation (G). Scale bars, 50 μm (A and E).
FIGURE 3.
FIGURE 3.
iICs in NBS-med show stemness characteristics. A, gene expression analysis is shown. Pluripotency and differentiation-associated gene expression status were compared in the indicated cells. ES derived cells at 14 days indicated the expression of each genes after differentiation for 14 days in a manner with Fig. 3B. B, experimental design is shown. Spontaneous differentiation was induced with EB formation by hanging-drop culture for 2 days and then seeded for attached culture. Inserted images are representative EBs (left images), and the resulting differentiated cells with multiple morphologies (right images) are indicated under each condition. Scale bars, 100 μm. C, gene expression analysis is shown. After differentiation induction, iICs in NBS-med still showed expression of pluripotency marker genes as well as differentiation marker genes in all germ layers.
FIGURE 4.
FIGURE 4.
CSC markers are enriched in CD133-positive fractions of iICs in NBS-med. A and B, FACS analysis identified CD133-positive cells in iICs in NBS-med. The threshold discriminating CD133 positive/negative fractions was determined by negative control experiments using alternative IgG (A, upper). The CD133 positive-fraction was about 35% of iICs in NBS-med (A, lower, and B). C, both CD133-positive and -negative fractions developed spheres on methylcellulose. D, expression of ES-related and CSC-related marker genes was compared between CD133-positive and -negative fractions. Expression of Oct3/4, c-Myc, and CSC-related marker genes is significantly high in CD133-positive fraction.
FIGURE 5.
FIGURE 5.
Differentiation environments affect the reduction of risks for cancerous stem cell development. A–C, differentiation of ESCs via EBs is shown. The experimental scheme is shown (A). EB dissociation and the following culture further led to differentiation in accordance with the decreased expression of ES-related and neural stem cell-related genes and enhanced expression of a premature neuron marker gene (Nestin) (B). At 28 days, ES-derived cells showed epithelial-like (white arrows) and fiber (yellow arrows) morphology. D and E, differentiation of ESCs in KSR-med is shown. The experimental scheme is shown (D). ESCs were also differentiated to three germ layers in KSR-med (E). Dissolved EBs were seeded in FBS-med condition or KSR condition, although dissolved EBs seeded into KSR-med massively died (data not shown). F, DNA content analysis in each state of cells is shown. Differentiating ESCs under FBS-med or KSR-med did not develop major genome instability. Scale bars, 50 μm.
FIGURE 6.
FIGURE 6.
Carcinogenic stress is induced during differentiation of ESCs in aberrant environments. A, cell growth in each medium condition is shown. Unlike continuously growing ESCs in the KSR + LIF condition, differentiating cells under each condition were growth-arrested at P2-P3. B and C, massive apoptosis induction was observed at P2-P3 with the TUNEL assay (B) and sub-G1 fractions (C). ES, embryonic stem. Sub-G1 fraction analysis revealed that apoptosis is mainly induced at P2-P3, which coincides with growth suppression (A). D, the status of spontaneously accumulated DNA lesions was determined by γH2AX foci formation (Da, also demonstrated in supplemental Fig. S3C) as well as γH2AX signal detection with Western blotting (Db). γH2AX signals were diminished at P3 in the differentiating cells in FBS- and ABS-med but not significantly decreased in cells in NBS-med (see P2 and P3 and quantified Fig. 4Dc). E and F, additional DNA damage accelerates the piled-up sphere formation. Experimental design is shown in E. ESCs were maintained and differentiated in ABS-med as in Fig. 1A, but the P3 cells in P3 + 1 day were treated with NCS for 3 days. After NCS treatment, cells were maintained with medium change as cells rapidly senesced (F, 3 days after NCS treatment). NCS treatment allows differentiating ESCs to form spheres in ABS-med. Images are representative, showing senescent cells, and resulting sphere development was induced under ABS-med with 25 ng/ml NCS treatment (F). The frequency of piled-up sphere development in ABS-med was also determined with different NCS doses (F, graph). Different than the Fig. 1 results, we observed piled-up colony formation in non-NCS-treated conditions, implying that a decrease in the times of passage allowed remaining undifferentiated cell proliferation. Scale bars, 100 μm. G, the status of DNA lesions in M-phase cells was determined by co-localized staining of γH2AX and phosphorylated histone H3 (pH3) (arrows). Images are representative. The quantified results are also shown (graph), indicating DNA-lesion carryover into the M phase. Scale bars, 50 μm.
FIGURE 7.
FIGURE 7.
Decreased intensity of growth acceleration could induce senescence-like morphology of differentiating ESCs in FBS-med. A, experimental design is shown. ESCs maintained with passaging every 2 days were held under 20, 10. Cells were passaged every 3 days in each medium condition until 9 days. B, shown is the growth curve of differentiating ESCs in the indicated conditions. A high concentration of FBS induced strong cell proliferation. C, DNA damage response in differentiating ESCs is shown. Western blotting shows PARP1 cleavage (3 and 6 days), γH2AX up-regulation (3 and 6 days), and H2AX diminishment (9 days) in differentiating ESCs. ES, ES, embryonic stem. D, cell morphologies in each medium at 9 days is shown. Senescence was not observed in 20 and 5% FBS condition, but differentiating ESCs in 10% FBS condition showed flattened and enlarged morphology. Lower panels show expanded images of the squares in the upper panels. Yellow arrows indicate the representative cells showing flattened and enlarged morphology. Scale bars, 50 μm.
FIGURE 8.
FIGURE 8.
Sufficient barrier response protects differentiating ESCs from senescence, preventing the development of cancerous stem cells. A, protection of differentiating ESCs from senescence by treatment with anti-cancer drugs is shown. The experimental scheme is shown (a). Akt inhibitor IV and PARP inhibitor AZD2281 led to the reduction of surviving cells (b) and senescent cells (c). B, prevention of cancerous stem cell development in the presence of ROS is shown. Development of cancerous stem cells under NBS-med was inhibited in the absence of monothioglycerol (MTG) as shown in the lower cell survival (a, compared with Fig. 6A), inhibition of senescence (b, P3 cells), and no piled-up sphere development (b, P6 + 10 days). The arrow indicates the sphere development in control conditions. Scale bars, 50 μm.
FIGURE 9.
FIGURE 9.
Model. In the process of ESC differentiation, cells subjected to environmental aberrancies are subjected to carcinogenic stress, resulting in the emergence of cancerous stem cells with genomic instability and mutations in p53 or Arf-p53 pathways.

Similar articles

Cited by

References

    1. Wicha M. S., Liu S., Dontu G. (2006) Cancer stem cells. An old idea, a paradigm shift. Cancer Res. 66, 1883–1890 - PubMed
    1. Werbowetski-Ogilvie T. E., Bhatia M. (2008) Pluripotent human stem cell lines. What we can learn about cancer initiation. Trends Mol. Med. 14, 323–332 - PubMed
    1. Chiba T., Zheng Y. W., Kita K., Yokosuka O., Saisho H., Onodera M., Miyoshi H., Nakano M., Zen Y., Nakanuma Y., Nakauchi H., Iwama A., Taniguchi H. (2007) Enhanced self-renewal capability in hepatic stem/progenitor cells drives cancer initiation. Gastroenterology 133, 937–950 - PubMed
    1. Liu Y., Clem B., Zuba-Surma E. K., El-Naggar S., Telang S., Jenson A. B., Wang Y., Shao H., Ratajczak M. Z., Chesney J., Dean D. C. (2009) Mouse fibroblasts lacking RB1 function form spheres and undergo reprogramming to a cancer stem cell phenotype. Cell Stem Cell 4, 336–347 - PMC - PubMed
    1. Bartkova J., Horejsí Z., Koed K., Krämer A., Tort F., Zieger K., Guldberg P., Sehested M., Nesland J. M., Lukas C., Ørntoft T., Lukas J., Bartek J. (2005) DNA damage response as a candidate anti-cancer barrier in early human tumorigenesis. Nature 434, 864–870 - PubMed

Publication types

MeSH terms