. 2012 Nov;153(11):5334-45.
doi: 10.1210/en.2012-1303. Epub 2012 Sep 7.

Molecular basis for glucocorticoid induction of the Kruppel-like factor 9 gene in hippocampal neurons

Affiliations

Molecular basis for glucocorticoid induction of the Kruppel-like factor 9 gene in hippocampal neurons

Pia Bagamasbad et al. Endocrinology. 2012 Nov.

Abstract

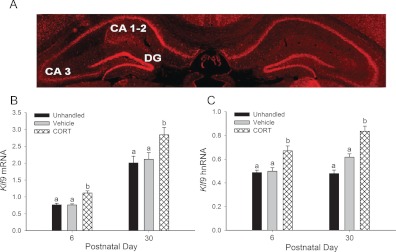
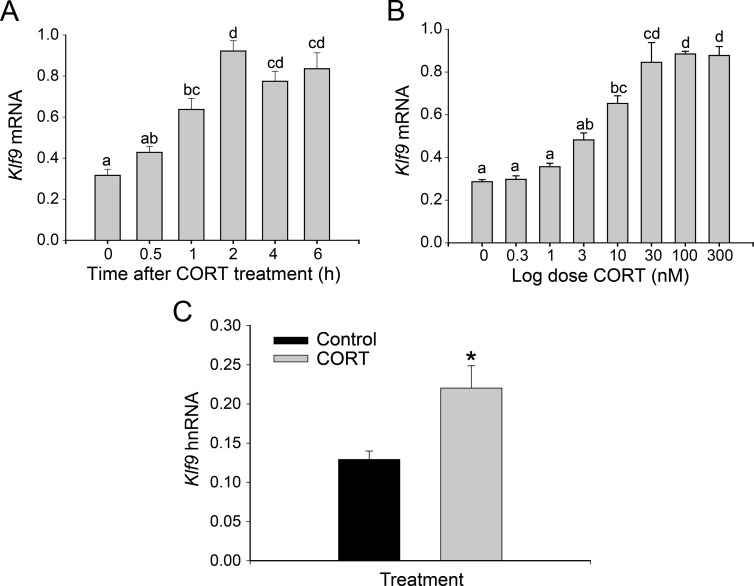
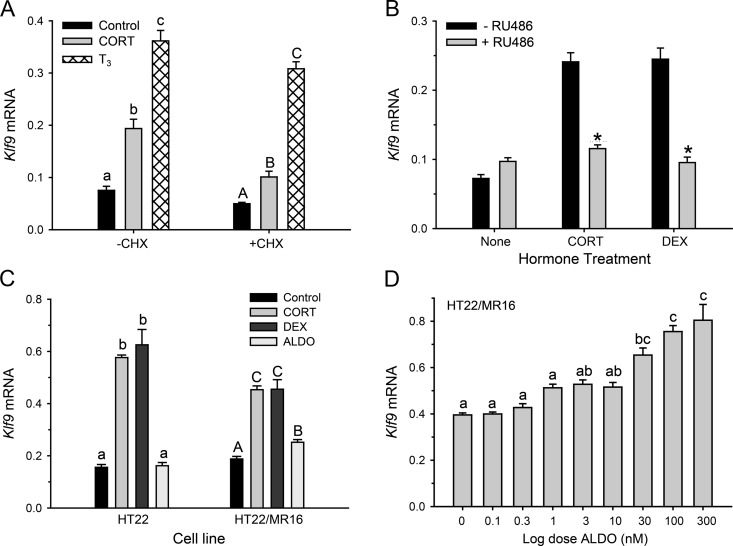
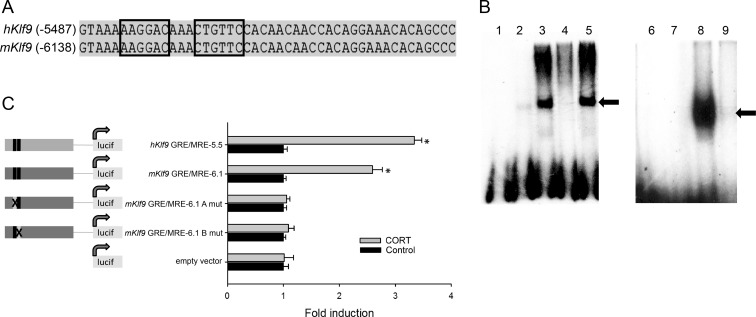
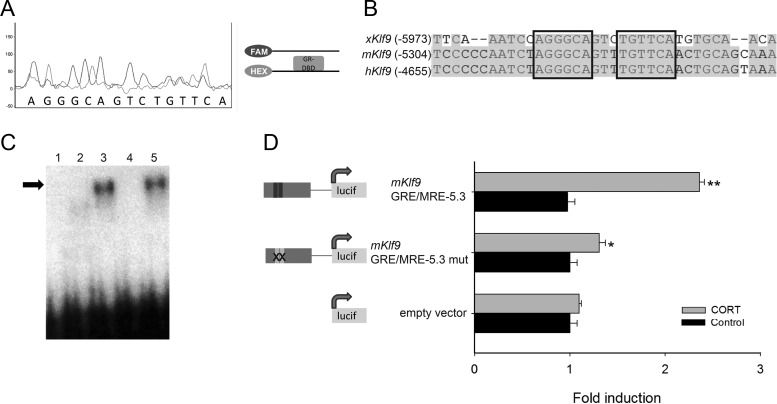
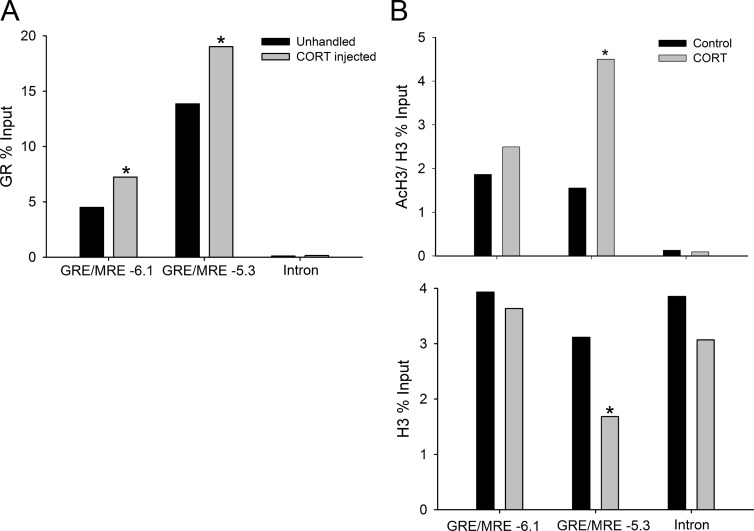
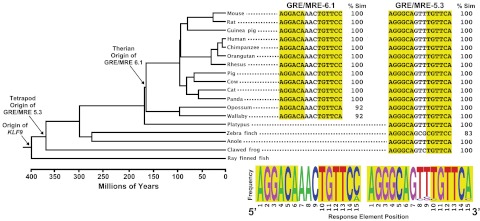
Stress has complex effects on hippocampal structure and function, which consequently affects learning and memory. These effects are mediated in part by circulating glucocorticoids (GC) acting via the intracellular GC receptor (GR) and mineralocorticoid receptor (MR). Here, we investigated GC regulation of Krüppel-like factor 9 (KLF9), a transcription factor implicated in neuronal development and plasticity. Injection of corticosterone (CORT) in postnatal d 6 and 30 mice increased Klf9 mRNA and heteronuclear RNA by 1 h in the hippocampal region. Treatment of the mouse hippocampal cell line HT-22 with CORT caused a time- and dose-dependent increase in Klf9 mRNA. The CORT induction of Klf9 was resistant to protein synthesis inhibition, suggesting that Klf9 is a direct CORT-response gene. In support of this hypothesis, we identified two GR/MR response elements (GRE/MRE) located -6.1 and -5.3 kb relative to the transcription start site, and we verified their functionality by enhancer-reporter, gel shift, and chromatin immunoprecipitation assays. The -5.3-kb GRE/MRE is largely conserved across tetrapods, but conserved orthologs of the -6.1-kb GRE/MRE were only detected in therian mammals. GC treatment caused recruitment of the GR, histone hyperacetylation, and nucleosome removal at Klf9 upstream regions. Our findings support a predominant role for GR, with a minor contribution of MR, in the direct regulation of Klf9 acting via two GRE/MRE located in the 5'-flanking region of the gene. KLF9 may play a key role in GC actions on hippocampal development and plasticity.


Figures

Fig. 1.
Fig. 1.
Injection of CORT increased Klf9 mRNA and hnRNA levels in the hippocampal region of the postnatal mouse brain. A, A representative coronal section of the hippocampal region of a LacZ-Klf9 heterozygous mouse generated by insertion of LacZ within the coding region of the Klf9 gene (19). Histochemistry was conducted for β-galactosidase with immunofluorescent detection using Cy3. B, PND 6 and 30 wild-type C57/BL6J mice were injected with vehicle (oil), CORT at a dose of 14 mg/kg bodyweight, or left unhandled. One hour after injection, animals were killed, the hippocampal region was dissected, and RNA extracted for measurement of Klf9 mRNA by RTqPCR (n = 8 at PND 6 and n = 5 at PND 30). C, PND 6 mice were injected with CORT as described above, and Klf9 hnRNA was measured by RTqPCR (n = 8). Klf9 mRNA and hnRNA were normalized to the mRNA level of the housekeeping gene GAPDH. Bars represent the mean ± sem, and letters above the means indicate significant differences among treatments (means with the same letter are not significantly different; Tukey's pairwise comparisons test; P < 0.05). DG, Dentate gyrus.
Fig. 2.
Fig. 2.
Treatment with CORT caused dose- and time-dependent increases in Klf9 mRNA in the mouse hippocampal-derived cell line HT-22. HT-22 cells were treated with 100 nm CORT for different times (A) or with increasing doses of CORT for 4 h (B) before harvest and analysis of Klf9 mRNA. C, HT-22 cells were treated with 100 nm CORT for 4 h before harvest and analysis of Klf9 hnRNA. In each experiment, HT-22 cells were treated with the hormone doses for the times indicated before cell harvest, RNA extraction, and analysis by RTqPCR. Klf9 mRNA and hnRNA were normalized to the mRNA level of the housekeeping gene GAPDH. Bars represent the mean ± sem (n = 4), and letters above the means indicate significant differences among hormone concentrations or time point (means with the same letter are not significantly different; Tukey's pairwise comparison test; P < 0.05). *, P < 0.05 (Student's t test).
Fig. 3.
Fig. 3.
Induction of Klf9 mRNA by CORT in HT-22 cells is resistant to protein synthesis inhibition. Klf9 can be regulated by the GR or by the MR. A, HT-22 cells were treated with or without CHX (100 μg/ml) for 30 min before addition of CORT (100 nm) or T3 (30 nm). Treatment with CHX plus hormones was continued for 4 h before cell harvest for analysis of Klf9 mRNA. We used T3 as a positive control, because earlier we showed that Klf9 is a direct TR target gene (16). B, HT-22 cells were cultured in the presence or absence of the GR-selective antagonist RU486 (1 μm) for 1 h before the addition of vehicle (100% EtOH), 100 nm CORT, or 10 nm of the GR-selective agonist DEX. Hormone treatment was continued for 4 h before cell harvest and analysis of Klf9 mRNA. C, HT-22 and HT-22/MR16 cells were treated with vehicle (100% EtOH), 100 nm CORT, 10 nm DEX, or 10 nm ALDO for 4 h before cell harvest for analysis of Klf9 mRNA. D, HT-22/MR16 were treated with increasing concentrations of the MR-selective agonist ALDO for 4 h before cell harvest for analysis of Klf9 mRNA. In each experiment, cells were treated with the hormone doses for the times indicated before cell harvest, RNA extraction, and gene expression analysis by RTqPCR. Klf9 mRNA was normalized to the mRNA level of the housekeeping gene GAPDH. Bars represent the mean ± sem (n = 4), and letters above the means indicate significant differences among hormone concentrations or time point (means with the same letter are not significantly different; Tukey's pairwise comparison test; P < 0.05). *, P < 0.05 (Student's t test).
Fig. 4.
Fig. 4.
Identification and functional analysis of a GRE/MRE located at −5.5 kb in the human and −6.1 kb in the mouse Klf9 genes. A, A ChIP-chip promoter assay conducted on chromatin isolated from HEK293-hMR+ cells identified a fragment of approximately 600 bp in the human Klf9 5′-flanking region that contains a functional GRE/MRE (Ziera, T., and S. Borden, unpublished data). The sequence alignment is of a portion of this genomic region of human and mouse Klf9 showing the presence of putative GRE/MRE sites in the two genes (half-sites are boxed) predicted by the TESS and Match programs. The numbers to the left of the alignment indicate the positions upstream of the TSS. The GRE/MRE in the human gene is centered at approximately −5.5 kb, and the GRE/MRE in the mouse gene is centered at approximately −6.1 kb. B, The ability of the GR to bind to the mouse Klf9 GRE/MRE-6.1 in vitro was tested by EMSA. Each reaction contained [32P]-labeled GRE/MRE-6.1 oligonucleotide as probe (lanes 1–5) and 2 μl of in vitro-synthesized luciferase protein (control, lane 2) or hGR protein (lanes 3–5). The GR binding to the probe was competed with 1.5 μm radioinert GRE/MRE-6.1 (lane 4) or mutant GRE/MRE-6.1 oligonucleotides (lane 5). We conducted EMSA with a MMTV GRE probe as a positive control for GR binding (right panel). Each reaction contained [32P]-labeled MMTV oligonucleotide as probe (lanes 6–9) and 2 μl of in vitro-synthesized luciferase protein (negative control, lane 7) or hGR protein (lanes 8 and 9). The GR binding to the MMTV probe was competed with 1.5 μm radioinert MMTV oligonucleotide (lane 9). The supershifted bands indicated by the arrows are the GR-bound probe. C, pGL4.23 reporter constructs containing the human GRE/MRE-5.5, mouse GRE/MRE-6.1, and corresponding half-site mutants (X; A, 5′half-site and B, 3′half-site) of the mouse GRE/MRE-6.1 were transfected into HT-22 cells. Cells were treated with CORT for 4 h before harvest and analysis by dual luciferase assay. Bars represent the mean ± sem (n = 5). Asterisks indicate statistically significant differences between vehicle (control) and CORT-treated cells for each enhancer-reporter construct (P < 0.0001; Student's t test).
Fig. 5.
Fig. 5.
Identification and functional analysis of an evolutionarily conserved GRE/MRE located at −5.3 kb in the mouse (−4.6 kb in the human) Klf9 gene. A, DNAse I protection assay with the hGR-DBD of the evolutionary conserved 179-bp fragment of the mouse Klf9 gene identified a GRE/MRE located approximately −5.3 kb relative to the TSS (see Materials and Methods). The light gray traces are from the probe incubated with the GR-DBD, whereas the dark gray traces are from the probe incubated without the GR-DBD. Areas where there is a dark gray peak but no light gray peak indicate nucleotides protected from DNAse I digestion by the GR-DBD. The nucleotide sequence is shown beneath the traces. B, Sequence alignment showing conservation of the GRE/MRE (mouse GRE/MRE-5.3) in human, mouse, and frog Klf9 genes (GRE/MRE half-sites are boxed). The numbers to the left of the alignment indicate the positions upstream of the TSS. The GRE/MRE in the human gene is centered at approximately −4.6 kb and in the frog gene at approximately −5.9 kb. C, The ability of the GR to bind to the mouse Klf9 GRE/MRE-5.3 was tested in vitro by EMSA. Each reaction contained [32P]-labeled GRE/MRE-5.3 oligo as probe (lanes 1–5) and 2 μl of in vitro-synthesized luciferase protein (negative control, lane 2) or hGR protein (lanes 3–5). The GR binding to the probe was competed with 1.5 μm radioinert GRE/MRE-5.3 (lane 4) or mutant GRE/MRE-5.3 oligonucleotides (lane 5). The supershifted bands indicated by the arrow are the GR-bound probe. D, pGL4.23 reporter constructs containing the mouse GRE/MRE-5.3 and corresponding GRE/MRE-5.3 mutant (X) were transfected into HT-22 cells. Cells were treated with CORT for 4 h before harvest and analysis by dual luciferase assay. Bars represent the mean ± sem (n = 5). Asterisks indicate statistically significant differences between vehicle (control) and CORT-treated cells for each enhancer-reporter construct (*, P < 0.05; **, P < 0.0001; Student's t test).
Fig. 6.
Fig. 6.
CORT promotes GR association, H3 acetylation, and nucleosome eviction at the 5′-flanking region of the mouse Klf9 gene. A, wild-type PND 6 mice were injected with CORT at a dose of 14 mg/kg bodyweight or left unhandled. One hour after injection, animals were killed, the hippocampal region was dissected, and chromatin extracted for GR ChIP assay. ChIP samples (n = 9) were analyzed by RTqPCR using TaqMan assays that targeted the GRE/MRE-6.1, GRE/MRE-5.3, or a distal intronic region (negative control) of the mouse Klf9 gene. Bars represent the mean ChIP signals expressed as a percentage of input. Statistical analysis was conducted on log10-transformed data, and the asterisks indicate statistically significant differences between unhandled and CORT-injected animals (P < 0.05; Student's t test). B, HT-22 cells were treated with EtOH vehicle or 100 nm CORT for 4 h before harvest for chromatin extraction and ChIP assay for AcH3 (top panel) and H3 (bottom panel). ChIP samples (n = 4) were analyzed by RTqPCR using TaqMan assays that target the GRE/MRE-6.1, GRE/MRE-5.3, or a distal intronic region (negative control) of the mouse Klf9 gene. Bars represent the mean ChIP signals expressed as a percentage of input. Statistical analysis was conducted on log10-transformed data, and the asterisks indicate statistically significant differences between vehicle (control) and CORT-treated cells (P < 0.01; Student's t test).
Fig. 7.
Fig. 7.
Origin and evolution of two GRE/MRE in vertebrate Klf9 genes. Phylogeny of vertebrate relationships with branch lengths scaled to average divergence time estimates (www.timetree.org). Arrows indicate the minimum origin of the Klf9 gene, and Klf9 GRE/MRE-5.3, and 6.1 (numbering based on the distance from the mouse Klf9 TSS). The GRE/MRE sequences for each taxon are shown to the right of the tree (when present). Half-sites are highlighted, and their percent similarities (Sim) to mouse are listed. The frequency of each nucleotide position for the taxa shown is depicted below its respective GRE/MRE alignment.

References

    1. Joëls M, Pu Z, Wiegert O, Oitzl MS, Krugers HJ. 2006. Learning under stress: how does it work? Trends Cogn Sci 10:152–158 - PubMed
    1. McEwen BS. 2008. Central effects of stress hormones in health and disease: understanding the protective and damaging effects of stress and stress mediators. Eur J Pharmacol 583:174–185 - PMC - PubMed
    1. Reul JM, de Kloet ER. 1985. Two receptor systems for corticosterone in rat brain: microdistribution and differential occupation. Endocrinology 117:2505–2511 - PubMed
    1. De Kloet ER, Vreugdenhil E, Oitzl MS, Joëls M. 1998. Brain corticosteroid receptor balance in health and disease. Endocr Rev 19:269–301 - PubMed
    1. Puymirat J. 1992. Thyroid receptors in the rat brain. Prog Neurobiol 39:281–294 - PubMed

Publication types

MeSH terms