. 2012 Dec 15;21(24):5246-53.
doi: 10.1093/hmg/dds375. Epub 2012 Sep 6.

Chromosome-specific accumulation of aneuploidy in the aging mouse brain

Affiliations

Chromosome-specific accumulation of aneuploidy in the aging mouse brain

Francesca Faggioli et al. Hum Mol Genet. .

Abstract

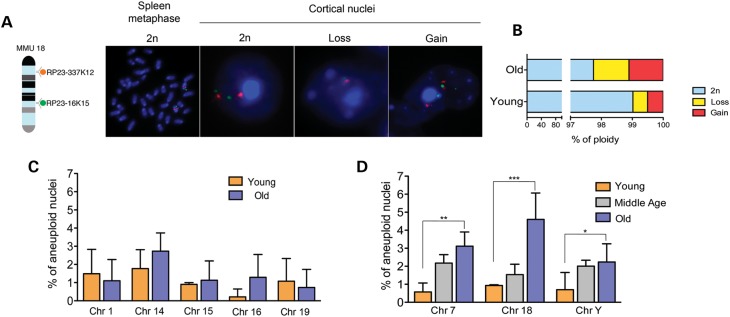
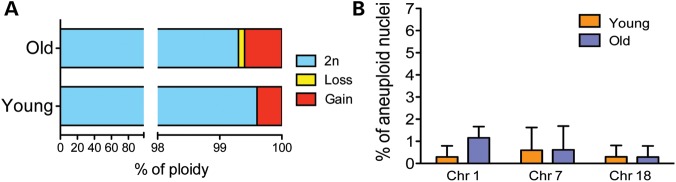
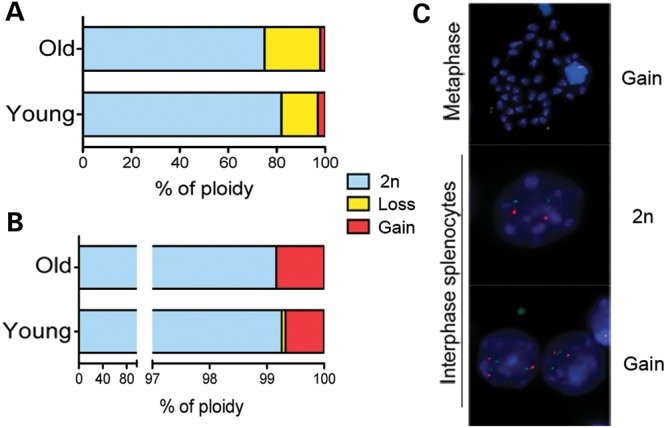
Chromosomal aneuploidy, the gain or loss of whole chromosomes, is a hallmark of pathological conditions and a causal factor of birth defects and cancer. A number of studies indicate that aneuploid cells are present at a high frequency in the brain of mice and humans, suggesting that mosaic aneuploidies are compatible with normal brain function and prompting the question about their consequences. To explore the possible contribution of aneuploidy to functional decline and loss of cognitive functions during aging, we used a quantitative, dual-labeling interphase-fluorescence in situ hybridization approach to compare aneuploidy levels of chromosomes 1, 7, 14, 15, 16, 18, 19 and Y in the cerebral cortex of 4- and 28-month-old mice. We show that aneuploidy accumulates with age in a chromosome-specific manner, with chromosomes 7, 18 and Y most severely affected, i.e. up to 9.8% of non-neuronal brain nuclei in 28-month-old animals for chromosome 18. While at early age, both neuronal and glial cells are affected equally, the age-related increase was limited to the non-neuronal nuclei. No age-related increase in aneuploidy was observed in the cerebellum or in the spleen of the same animals. Extrapolating the average frequencies of aneuploidy from the average over 8 chromosomes to all 20 mouse chromosomes would indicate an almost 50% aneuploidy frequency in aged mouse brain. Such high levels of genome instability could well be a factor in age-related neurodegeneration.


Figures

Figure 1.
Figure 1.
Analysis of ploidy in cortical nuclei of young and old mice. (A) Two differently labeled BAC clones (red spectrum orange and green spectrum green) mapping to chromosome 18 at two distinct genomic loci enable the identification of diploid from aneuploid cells. A diploid cell contains two copies of each autosome, which are identified in our dual labeling system by two red and two green signals, thus allowing clear identification. Examples of diploid cells (2n), one in metaphases and one in interphase are shown. When a cell is aneuploid, its DNA content deviates from the expected two copies for single chromosomes. In our case, we observed a loss of chromosome 18, visualized by one red and one green signal (middle panel) and gain of chromosome 18, visualized by three red and three green signals (right panel). (B) The analysis of global ploidy on cortical nuclei for the eight chromosomes tested demonstrates that aneuploidy levels increase with age. (C) Individual aneuploidy frequencies for the chromosomes that did not show an age-related increase. (D) Statistically significant age-related increase in aneuploidy for chromosomes 7, 18 and Y (**P = 0.01, ***P < 0.0001, *P = 0.02, respectively).
Figure 2.
Figure 2.
Identification of cell types targeted by aneuploidy in the old cortex. (A) Flow cytometric analysis of cortical nuclei with anti-NeuN antibody, detected with Alexa-488 secondary antibody. Isotype control and anti-NeuN specific staining on old cortex are shown. Isolated mouse cortical nuclei were gated based on forward scatter and side scatter (data not shown) and gated into NeuN+ DAPI+ and NeuN− DAPI+ populations. The gates were set based on the IgG1 isotype control. (B) Levels of aneuploidy obtained by interphase FISH analysis of chromosomes 1 and 18 performed on FACS enriched cortical neuronal and non- neuronal nuclei in 28-month-old mice. Chromosome 18 shows a statistically significantly higher level of aneuploidy than chromosome 1 in NeuN− cells (dark gray *P < 0.0001). (C) To avoid interference of the locus specific probe with the green fluorescence arising from NeuN staining (Alexa 488), the same BAC probe previously used has been labeled with spectrum Aqua. We chose yellow as pseudo-color to display the spectrum Aqua dye. Examples of NeuN- cortical nuclei aneuploid for chromosomes 1 and 18 performed with our two-color FISH approach are shown. The left panel shows a nucleus that carries three copies of chromosome 1, visualized by three red and three yellow signals (gain). The right panel shows that a nucleus carries one copy of chromosome 18, visualized by one red and one yellow signal (loss).
Figure 3.
Figure 3.
Analysis of ploidy in nuclei from the cerebellum of young and old mice. (A) The picture summarizes the analysis of global ploidy on cerebellum nuclei performed for chromosomes 1, 7 and 18, one of the least and of the most aneuploid chromosome founded previously in the cortex. The analysis demonstrates that the accumulation of aneuploidy during aging in the cerebellum for the chromosomes tested is absent. (B) Aneuploidy frequencies for single chromosomes 1,7 and 18 also show a lack of individual significant increase during aging.
Figure 4.
Figure 4.
Analysis of ploidy in splenocytes of young and old mice. (A) Chromosomes count in metaphase spreads. (B) 2-color FISH analysis perfprmed on chromosomes 1, 16 and 18 on young FISH analysis on young and old splenocytes revealed that aneuploidy does not increase with age and has similar frequencies for all chromosomes analyzed (plotted average of the four chromosomes). (C) Examples of ploidy detected by two-color FISH analysis for chromosome 16 on splenocytes. FISH signals corresponding to 2n and 2n plus 1 extra chromosome 16 in interphase and metaphase cells are shown.

Similar articles

Cited by

References

    1. Iourov I.Y., Vorsanova S.G., Yurov Y.B. Chromosomal variation in mammalian neuronal cells: known facts and attractive hypotheses. Int. Rev. Cytol. 2006;249:143–191. doi:10.1016/S0074-7696(06)49003-3. - DOI - PubMed
    1. Suzumori N., Sugiura-Ogasawara M. Genetic factors as a cause of miscarriage. Curr. Med. Chem. 2010;17:3431–3437. - PubMed
    1. Kops G.J., Weaver B.A., Cleveland D.W. On the road to cancer: aneuploidy and the mitotic checkpoint. Nat. Rev. Cancer. 2005;5:773–785. doi:10.1038/nrc1714. - DOI - PubMed
    1. Weaver B.A., Silk A.D., Montagna C., Verdier-Pinard P., Cleveland D.W. Aneuploidy acts both oncogenically and as a tumor suppressor. Cancer Cell. 2007;11:25–36. doi:10.1016/j.ccr.2006.12.003. - DOI - PubMed
    1. Jacobs P.A., Court Brown W.M., Doll R. Distribution of human chromosome counts in relation to age. Nature. 1961;191:1178–1180. doi:10.1038/1911178a0. - DOI - PubMed