

Accurate estimation of short read mapping quality for next-generation genome sequencing
- PMID: 22962451
- PMCID: PMC3436835
- DOI: 10.1093/bioinformatics/bts408
Accurate estimation of short read mapping quality for next-generation genome sequencing
Abstract
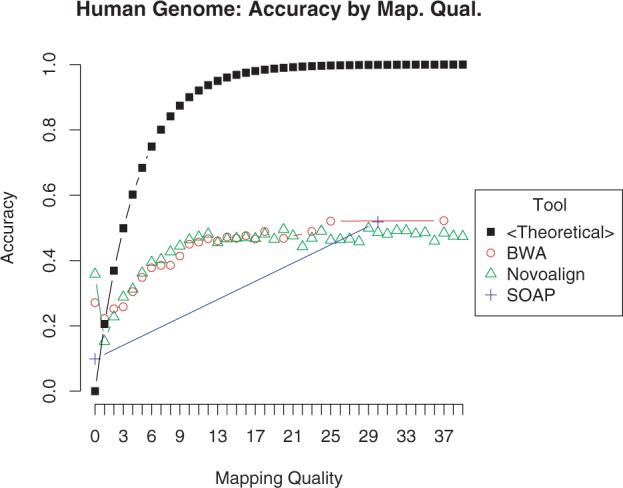
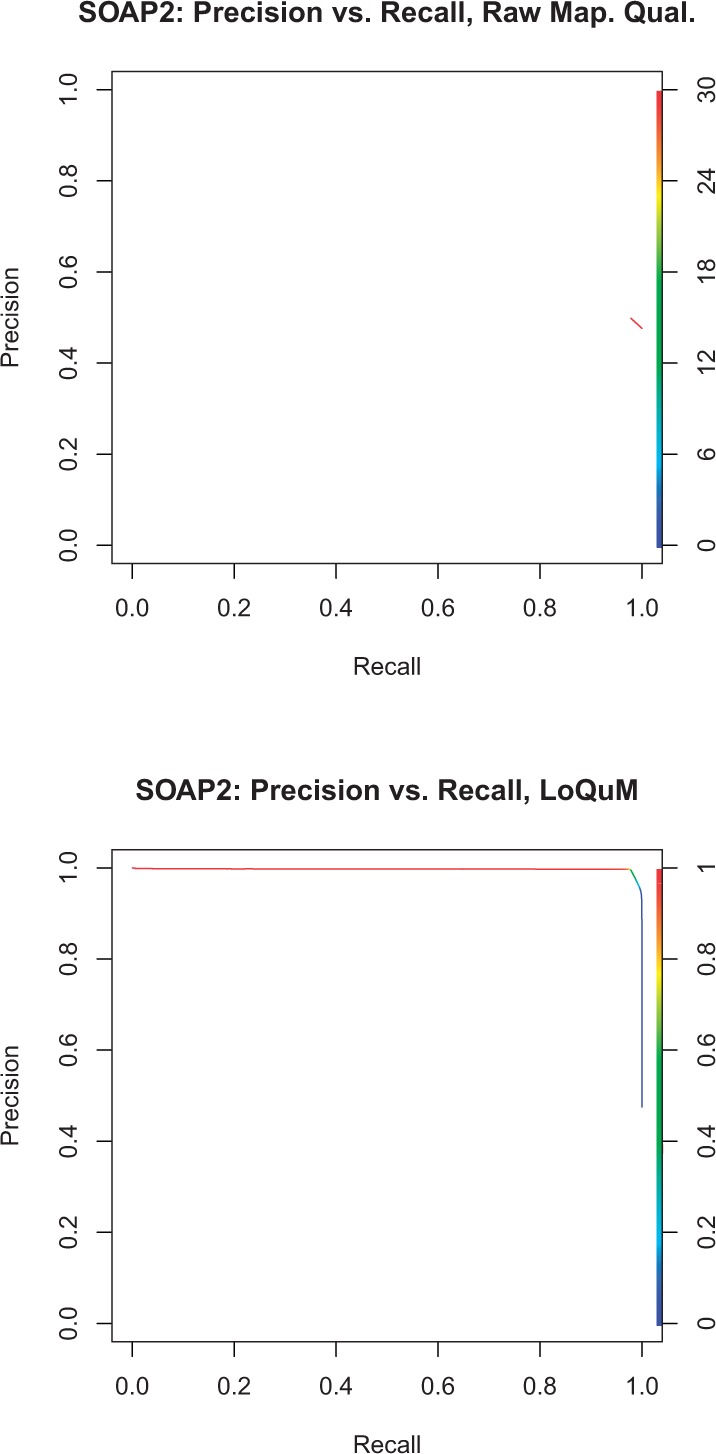
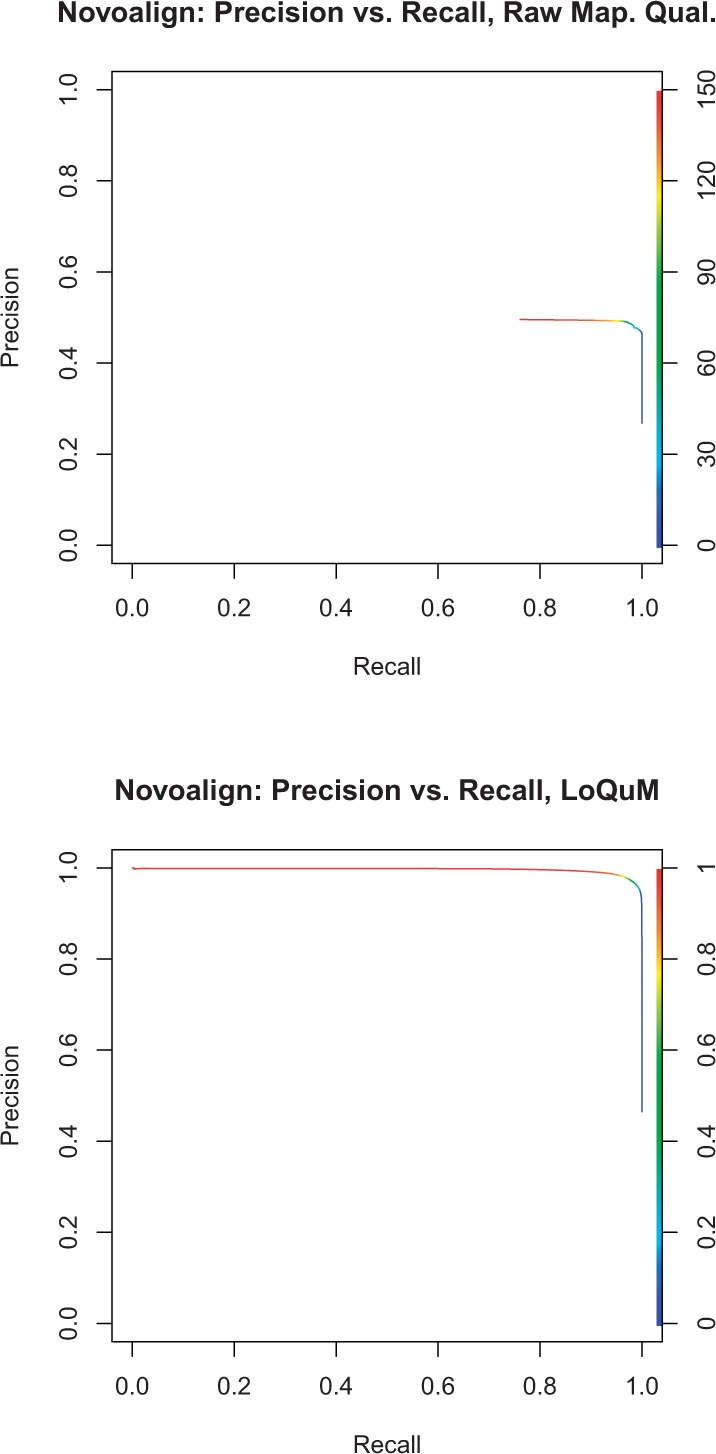
Motivation: Several software tools specialize in the alignment of short next-generation sequencing reads to a reference sequence. Some of these tools report a mapping quality score for each alignment-in principle, this quality score tells researchers the likelihood that the alignment is correct. However, the reported mapping quality often correlates weakly with actual accuracy and the qualities of many mappings are underestimated, encouraging the researchers to discard correct mappings. Further, these low-quality mappings tend to correlate with variations in the genome (both single nucleotide and structural), and such mappings are important in accurately identifying genomic variants.
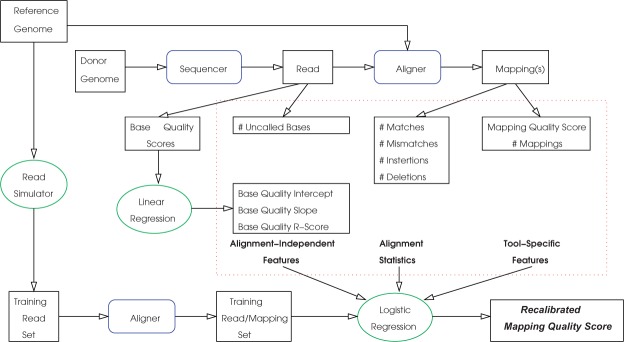
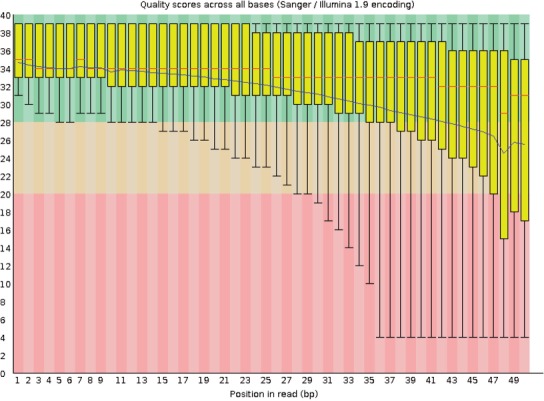
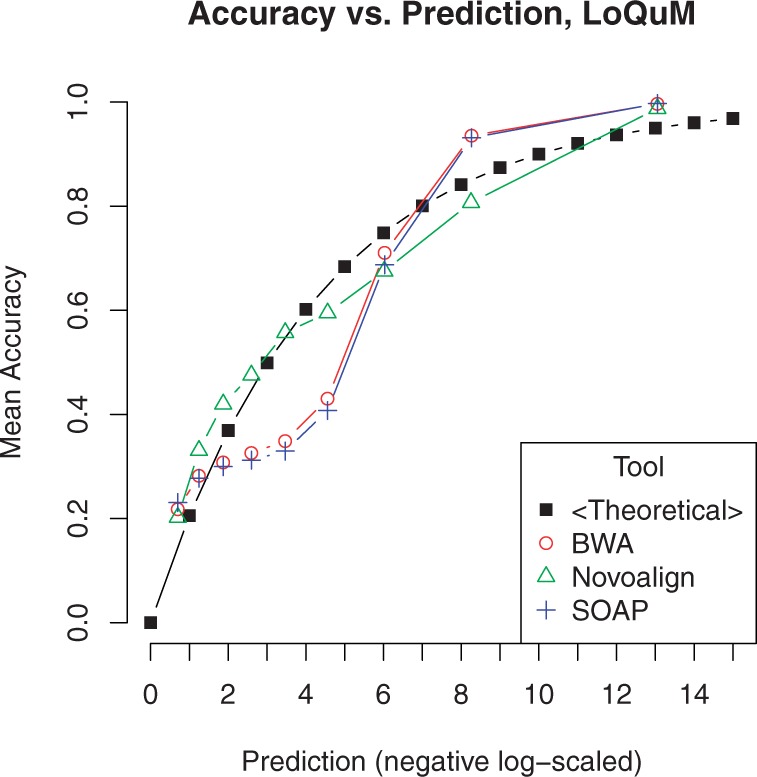
Approach: We develop a machine learning tool, LoQuM (LOgistic regression tool for calibrating the Quality of short read mappings, to assign reliable mapping quality scores to mappings of Illumina reads returned by any alignment tool. LoQuM uses statistics on the read (base quality scores reported by the sequencer) and the alignment (number of matches, mismatches and deletions, mapping quality score returned by the alignment tool, if available, and number of mappings) as features for classification and uses simulated reads to learn a logistic regression model that relates these features to actual mapping quality.
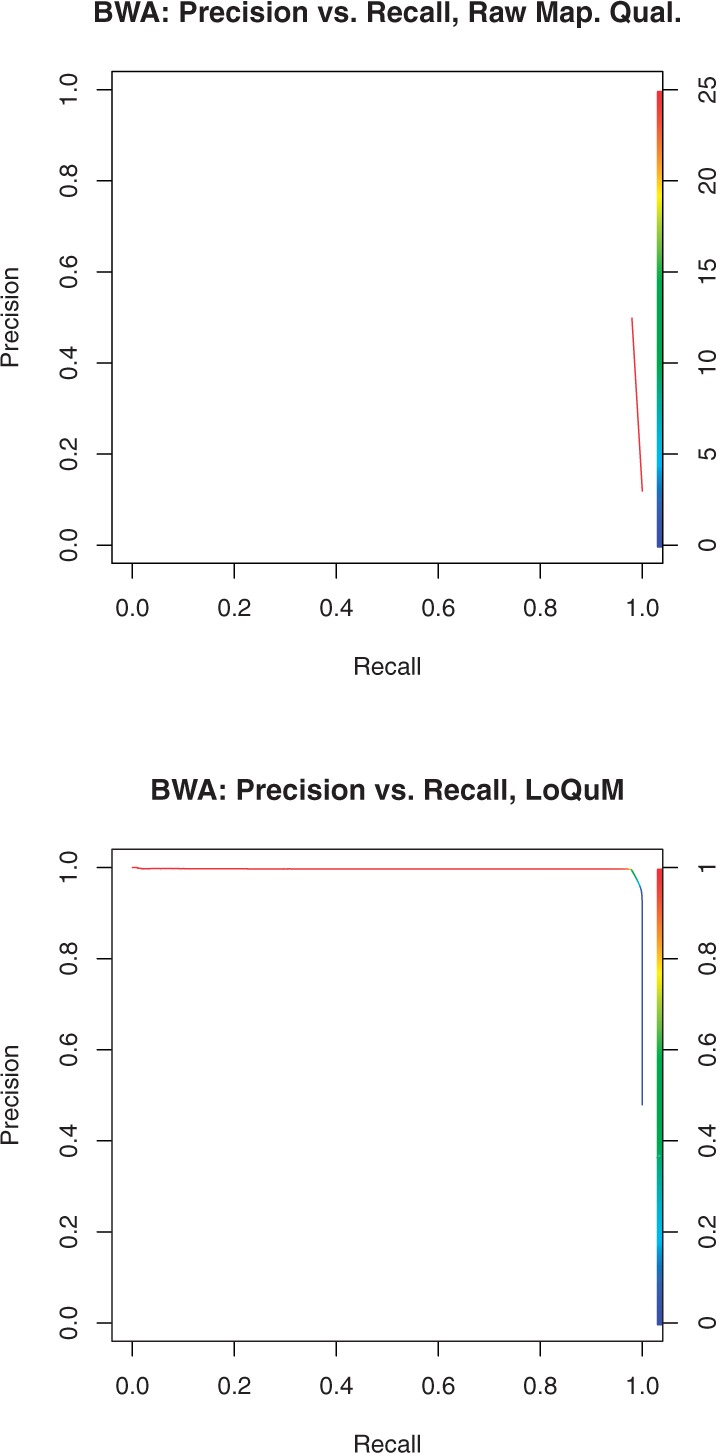
Results: We test the predictions of LoQuM on an independent dataset generated by the ART short read simulation software and observe that LoQuM can 'resurrect' many mappings that are assigned zero quality scores by the alignment tools and are therefore likely to be discarded by researchers. We also observe that the recalibration of mapping quality scores greatly enhances the precision of called single nucleotide polymorphisms.
Availability: LoQuM is available as open source at http://compbio.case.edu/loqum/.
Contact: matthew.ruffalo@case.edu.
Figures
Similar articles
-
Re-alignment of the unmapped reads with base quality score.BMC Bioinformatics. 2015;16 Suppl 5(Suppl 5):S8. doi: 10.1186/1471-2105-16-S5-S8. Epub 2015 Mar 18. BMC Bioinformatics. 2015. PMID: 25860434 Free PMC article.
-
Comparative analysis of algorithms for next-generation sequencing read alignment.Bioinformatics. 2011 Oct 15;27(20):2790-6. doi: 10.1093/bioinformatics/btr477. Epub 2011 Aug 19. Bioinformatics. 2011. PMID: 21856737
-
Ψ-RA: a parallel sparse index for genomic read alignment.BMC Genomics. 2011;12 Suppl 2(Suppl 2):S7. doi: 10.1186/1471-2164-12-S2-S7. Epub 2011 Jul 27. BMC Genomics. 2011. PMID: 21989248 Free PMC article.
-
Alignment of Next-Generation Sequencing Reads.Annu Rev Genomics Hum Genet. 2015;16:133-51. doi: 10.1146/annurev-genom-090413-025358. Epub 2015 May 4. Annu Rev Genomics Hum Genet. 2015. PMID: 25939052 Review.
-
Performance optimization in DNA short-read alignment.Bioinformatics. 2022 Apr 12;38(8):2081-2087. doi: 10.1093/bioinformatics/btac066. Bioinformatics. 2022. PMID: 35139149 Free PMC article. Review.
Cited by
-
A framework for organizing cancer-related variations from existing databases, publications and NGS data using a High-performance Integrated Virtual Environment (HIVE).Database (Oxford). 2014 Mar 25;2014:bau022. doi: 10.1093/database/bau022. Print 2014. Database (Oxford). 2014. PMID: 24667251 Free PMC article.
-
SeqControl: process control for DNA sequencing.Nat Methods. 2014 Oct;11(10):1071-5. doi: 10.1038/nmeth.3094. Epub 2014 Aug 31. Nat Methods. 2014. PMID: 25173705
-
Comparison of single-nucleotide variants identified by Illumina and Oxford Nanopore technologies in the context of a potential outbreak of Shiga toxin-producing Escherichia coli.Gigascience. 2019 Aug 1;8(8):giz104. doi: 10.1093/gigascience/giz104. Gigascience. 2019. PMID: 31433830 Free PMC article.
-
Epigenomic profiling of primary gastric adenocarcinoma reveals super-enhancer heterogeneity.Nat Commun. 2016 Sep 28;7:12983. doi: 10.1038/ncomms12983. Nat Commun. 2016. PMID: 27677335 Free PMC article.
-
Re-alignment of the unmapped reads with base quality score.BMC Bioinformatics. 2015;16 Suppl 5(Suppl 5):S8. doi: 10.1186/1471-2105-16-S5-S8. Epub 2015 Mar 18. BMC Bioinformatics. 2015. PMID: 25860434 Free PMC article.
References
-
- Andrews S. FastQC: a quality control tool for high throughput sequence data. 2010. Available at http://www.bioinformatics.bbsrc.ac.uk/projects/fastqc/. (last accessed date September 12, 2011)
Publication types
MeSH terms
Grants and funding
LinkOut - more resources
Full Text Sources
Other Literature Sources
