

Uncovering the co-evolutionary network among prokaryotic genes
- PMID: 22962457
- PMCID: PMC3436823
- DOI: 10.1093/bioinformatics/bts396
Uncovering the co-evolutionary network among prokaryotic genes
Abstract
Motivation: Correlated events of gains and losses enable inference of co-evolution relations. The reconstruction of the co-evolutionary interactions network in prokaryotic species may elucidate functional associations among genes.
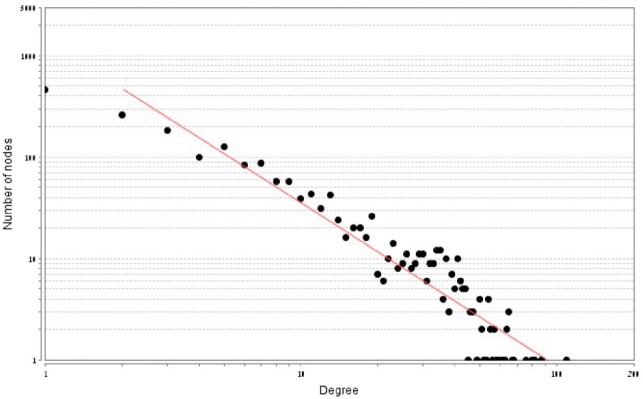
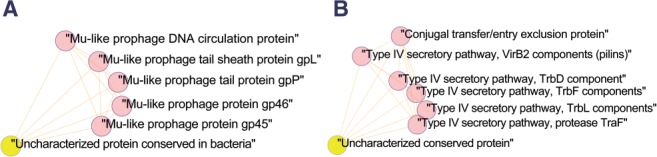
Results: We developed a novel probabilistic methodology for the detection of co-evolutionary interactions between pairs of genes. Using this method we inferred the co-evolutionary network among 4593 Clusters of Orthologous Genes (COGs). The number of co-evolutionary interactions substantially differed among COGs. Over 40% were found to co-evolve with at least one partner. We partitioned the network of co-evolutionary relations into clusters and uncovered multiple modular assemblies of genes with clearly defined functions. Finally, we measured the extent to which co-evolutionary relations coincide with other cellular relations such as genomic proximity, gene fusion propensity, co-expression, protein-protein interactions and metabolic connections. Our results show that co-evolutionary relations only partially overlap with these other types of networks. Our results suggest that the inferred co-evolutionary network in prokaryotes is highly informative towards revealing functional relations among genes, often showing signals that cannot be extracted from other network types.
Availability and implementation: Available under GPL license as open source.
Contact: talp@post.tau.ac.il.
Supplementary information: Supplementary data are available at Bioinformatics online.
Figures


Similar articles
-
Algorithms for computing parsimonious evolutionary scenarios for genome evolution, the last universal common ancestor and dominance of horizontal gene transfer in the evolution of prokaryotes.BMC Evol Biol. 2003 Jan 6;3:2. doi: 10.1186/1471-2148-3-2. Epub 2003 Jan 6. BMC Evol Biol. 2003. PMID: 12515582 Free PMC article.
-
Microbial genotype-phenotype mapping by class association rule mining.Bioinformatics. 2008 Jul 1;24(13):1523-9. doi: 10.1093/bioinformatics/btn210. Epub 2008 May 8. Bioinformatics. 2008. PMID: 18467347 Free PMC article.
-
Updated clusters of orthologous genes for Archaea: a complex ancestor of the Archaea and the byways of horizontal gene transfer.Biol Direct. 2012 Dec 14;7:46. doi: 10.1186/1745-6150-7-46. Biol Direct. 2012. PMID: 23241446 Free PMC article.
-
A genomic perspective on protein families.Science. 1997 Oct 24;278(5338):631-7. doi: 10.1126/science.278.5338.631. Science. 1997. PMID: 9381173 Review.
-
Ancient origin of the tryptophan operon and the dynamics of evolutionary change.Microbiol Mol Biol Rev. 2003 Sep;67(3):303-42, table of contents. doi: 10.1128/MMBR.67.3.303-342.2003. Microbiol Mol Biol Rev. 2003. PMID: 12966138 Free PMC article. Review.
Cited by
-
Mapping proteins in the presence of paralogs using units of coevolution.BMC Bioinformatics. 2013;14 Suppl 15(Suppl 15):S18. doi: 10.1186/1471-2105-14-S15-S18. Epub 2013 Oct 15. BMC Bioinformatics. 2013. PMID: 24564758 Free PMC article.
-
A phylogenetic method to perform genome-wide association studies in microbes that accounts for population structure and recombination.PLoS Comput Biol. 2018 Feb 5;14(2):e1005958. doi: 10.1371/journal.pcbi.1005958. eCollection 2018 Feb. PLoS Comput Biol. 2018. PMID: 29401456 Free PMC article.
-
Horizontal Gene Transfer as a Source of Conflict and Cooperation in Prokaryotes.Front Microbiol. 2020 Jul 17;11:1569. doi: 10.3389/fmicb.2020.01569. eCollection 2020. Front Microbiol. 2020. PMID: 32849327 Free PMC article.
-
Phylogenetic Clustering of Genes Reveals Shared Evolutionary Trajectories and Putative Gene Functions.Genome Biol Evol. 2018 Sep 1;10(9):2255-2265. doi: 10.1093/gbe/evy178. Genome Biol Evol. 2018. PMID: 30137329 Free PMC article.
-
The Community Coevolution Model with Application to the Study of Evolutionary Relationships between Genes Based on Phylogenetic Profiles.Syst Biol. 2023 Jun 17;72(3):559-574. doi: 10.1093/sysbio/syac052. Syst Biol. 2023. PMID: 35904761 Free PMC article.
References
-
- Ashkenazy H., Kliger Y. Reducing phylogenetic bias in correlated mutation analysis. Prot. Eng. Des. Sel. 2010;23:321–326. - PubMed
-
- Barabasi A.L., Oltvai Z.N. Network biology: understanding the cell's functional organization. Nat. Rev. Genet. 2004;5:101–113. - PubMed
-
- Barker D., et al. Constrained models of evolution lead to improved prediction of functional linkage from correlated gain and loss of genes. Bioinformatics. 2007;23:14–20. - PubMed
-
- Batagelj V., Mrvar A. Pajek - analysis and visualization of large networks. Lect. Notes Comput. Sci. 2002;2265:477–478.
-
- Benjamini Y., Hochberg Y. Controlling the false discovery rate: a practical and powerful approach to multiple testing. J. R Stat. Soc. B. 1995;57:289–300.
