. 2012;7(9):e38801.
doi: 10.1371/journal.pone.0038801. Epub 2012 Sep 4.

Interleukin-6 induces S100A9 expression in colonic epithelial cells through STAT3 activation in experimental ulcerative colitis

Affiliations

Interleukin-6 induces S100A9 expression in colonic epithelial cells through STAT3 activation in experimental ulcerative colitis

Min Jeoung Lee et al. PLoS One. 2012.

Abstract

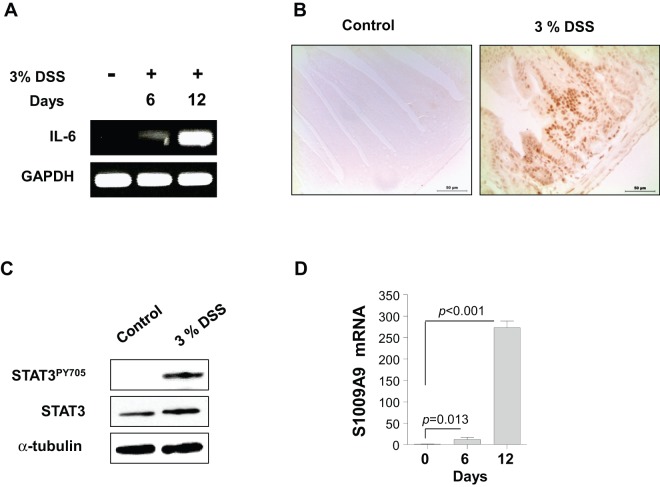
Background: Intestinal epithelium is essential for maintaining normal intestinal homeostasis; its breakdown leads to chronic inflammatory pathologies, such as inflammatory bowel diseases (IBDs). Although high concentrations of S100A9 protein and interleukin-6 (IL-6) are found in patients with IBD, the expression mechanism of S100A9 in colonic epithelial cells (CECs) remains elusive. We investigated the role of IL-6 in S100A9 expression in CECs using a colitis model.

Methods: IL-6 and S100A9 expression, signal transducer and activator of transcription 3 (STAT3) phosphorylation, and infiltration of immune cells were analyzed in mice with dextran sulfate sodium (DSS)-induced colitis. The effects of soluble gp130-Fc protein (sgp130Fc) and S100A9 small interfering (si) RNA (si-S100A9) on DSS-induced colitis were evaluated. The molecular mechanism of S100A9 expression was investigated in an IL-6-treated Caco-2 cell line using chromatin immunoprecipitation assays.

Results: IL-6 concentrations increased significantly in the colon tissues of DSS-treated mice. sgp130Fc or si-S100A9 administration to DSS-treated mice reduced granulocyte infiltration in CECs and induced the down-regulation of S100A9 and colitis disease activity. Treatment with STAT3 inhibitors upon IL-6 stimulation in the Caco-2 cell line demonstrated that IL-6 mediated S100A9 expression through STAT3 activation. Moreover, we found that phospho-STAT3 binds directly to the S100A9 promoter. S100A9 may recruit immune cells into inflamed colon tissues.

Conclusions: Elevated S100A9 expression in CECs mediated by an IL-6/STAT3 signaling cascade may play an important role in the development of colitis.


Conflict of interest statement

Competing Interests: The authors have declared that no competing interests exist.

Figures

Figure 1
Figure 1. Increased IL-6 expression, activation of STAT3 in colon tissue, and S100A9 in isolated colonic epithelial cells (CECs), from a mouse model of dextran sulfate sodium (DSS)-induced colitis.
(A) In control and DSS-treated mice at 6 or 12 days after DSS administration, colon tissues were homogenized using a tissue homogenizer. IL-6 and GAPDH mRNA levels in each group of colonic tissue samples was analyzed by conventional reverse-transcription polymerase chain reaction assays. Data are representative of three independent experiments. (B) Activation of STAT3 (STAT3PY705) in colon sections on day 6 from mice treated with 0% or 3% DSS was determined by immunohistochemistry. Scale bars = 100 µm. Data are representative of four independent experiments. (C) CECs from mice treated with 0% or 3% DSS were purified on day 6. Expressions of STAT3PY705, total STAT3, and alpha-tubulin were analyzed by immunoblotting. Data are representative of four independent experiments. (D) CECs from mice treated with 3% DSS for 0, 6, or 12 days were prepared, and S100A9 mRNA expression was analyzed by quantitative reverse-transcription polymerase chain reaction (qRT-PCR). The qRT-PCR data were analyzed by comparative Ct quantification. Data are presented as means ± standard deviations of values from six mice per group. P values were obtained using the two-tailed Student's t-test.
Figure 2
Figure 2. Effect of soluble gp130-Fc (sgp130Fc) injection on the expression of S100A9 in colonic epithelial cells (CECs) from mice with dextran sulfate sodium (DSS)-induced colitis.
(A) Changes in the disease activity indices (DAI) of mice treated with DSS + phosphate-buffered saline (PBS) or DSS + sgp130Fc were assessed daily. Data are presented as means ± standard deviations of values from six mice per group. *p<0.01 vs. control mice (two-tailed Student's t-test). (B) Colon sections from mice in each group were examined for STAT3PY705 (red) levels by immunofluorescence on day 6 of DSS treatment. Data are representative of three independent experiments. DAPI, 4′,6-diamidino-2-phenylindole. Scale bars = 50 µm. (C) CECs from mice treated with or without 3% DSS for 8 days and a subsequent sgp130Fc or PBS injection were prepared, and S100A9 mRNA expression was analyzed by quantitative reverse-transcription polymerase chain reaction (qRT-PCR). Data are presented as means ± standard deviations of values from six mice per group. P values were obtained using the two-tailed Student's t-test. (D) Expression of S100A9 in colon sections from mice treated with 0% or 3% DSS for 10 days was determined by immunohistochemistry. Scale bars = 100 µm. Data are representative of four independent experiments.
Figure 3
Figure 3. Effect of small interfering STAT3 chitosan nanoparticle (si-STAT3/CH-NP) injection on the expression of S100A9 in colonic epithelial cells (CECs).
(A) si-negative/CH-NPs or si-STAT3/CH-NPs were injected intravenously twice on days 2 and 3 into 3% DSS-treated mice. Changes in the disease activity indices (DAI) of mice injected with si-negative/CH-NPs or si-STAT3/CH-NPs were assessed daily. Data are presented as means ± standard deviations of values from six mice per group. *p<0.01, **p<0.001 vs. control mice (two-tailed Student's t-test). (B) On day 8 of DSS exposure, CECs from each group of mice were purified and mRNA levels of STAT3, S100A9, and GAPDH were analyzed by conventional RT-PCR. Data are representative of three independent experiments. (C) Expression of S100A9 in colon sections from mice treated with si-negative/CH-NPs or si-STAT3/CH-NPs at 8 days was determined by immunohistochemistry. Scale bars = 100 µm. Data are representative of four independent experiments.
Figure 4
Figure 4. The role of the interleukin-6 (IL-6)/STAT3 axis in the expression of S100A9 in the Caco-2 cell line.
(A) Caco-2 cells were stimulated with IL-6 (20 ng/ml) for 0, 30, or 60 min, and the cell lysates were analyzed by immunoblotting for STAT3PY705 and total STAT3. Data are representative of three independent experiments. (B) The expression levels of S100A9 in Caco-2 cells stimulated with IL-6 (20 ng/ml) for 0, 3, or 6 h were analyzed by quantitative reverse-transcription polymerase chain reaction (qRT-PCR, left panel). The qRT-PCR data were analyzed by comparative Ct quantification. S100A9 levels in the culture supernatants of Caco-2 stimulated with IL-6 for 0, 6, 12, or 24 h were determined by ELISA (right panel). Data are presented as means ± standard deviations of values from each group. (C) Up-regulation of IL-6-mediated S100A9 expression by STAT3 activation in Caco-2 cells. To measure the expression level of S100A9 in Caco-2 cells, the cells were pretreated with or without one of inhibitors for 3 h and then incubated in the presence or absence of IL-6 (20 ng/ml) for 6 h:S3I (20 µM); or STAT3 inhibitor peptide (5 µM). The transcriptional levels of S100A9 were analyzed by qRT-PCR (left panel) and secreted S100A9 were determined by ELISA (right panel). Data are presented as mean ± standard deviations of values from each group. P values were obtained using the two-tailed Student's t-test (B, C). (D) Caco-2 cells were stimulated with or without IL-6 (20 ng/ml) for 24 h. The cell lysates were prepared and sonicated (30 s on/1 min off for three cycles) to form a sheared, cross-linked chromatin. After incubation with anti-STAT3PY705 or rabbit immunoglobulin G (IgG), the eluted DNA was amplified and analyzed by conventional polymerase chain reaction assay. Data are representative of four independent experiments.
Figure 5
Figure 5. Gr-1+ cells infiltration in the colonic epithelial area of mice with dextran sulfate sodium (DSS)-induced colitis.
(A) Colon sections from control mice and those treated with 3% DSS + phosphate-buffered saline (PBS) or 3% DSS + soluble gp130-Fc (sgp130Fc) were examined for Gr-1 (green), CD11c (red), and 4′,6-diamidino-2-phenylindole (DAPI; blue) expression by immunofluorescence on day 10 of DSS treatment. Data are representative of three independent experiments. Scale bars = 50 µm. (B) Colon histology was examined in control and DSS-treated mice at 10 days after DSS or DSS + sgp130FC administration by hematoxylin and eosin staining of paraffin-embedded sections. Scale bars = 100 µm. Data are representative of three independent experiments. (C–D) Small interfering-negative chitosan nanoparticles (si-negative/CH-NPs) or si-S100A9/CH-NPs were injected intravenously twice on days 2 and 3 into 3% DSS-treated mice. On day 10 of DSS-exposure, expression of S100A9 in colon sections from mice was determined by qRT-PCR (C) and immunohistochemistry (D). qRT-PCR data are presented as mean ± standard deviations of values from each group. P values were obtained using the two-tailed Student's t-test Scale bars = 100 µm. Immunohistochemistry data are representative of four independent experiments. (E) The colon sections of DSS-exposed mice receiving si-negative/CH-NP or si-S100A9/CH-NP injections were examined for Gr-1 (green), CD11c (red), and DAPI (blue) expression by immunofluorescence on day 10 of DSS treatment. Data are representative of three independent experiments. Scale bars = 50 µm. (F) Colon histology was examined in control and DSS-treated mice at 10 days after si-negative/CH-NP or si-S100A9/CH-NP injections by hematoxylin and eosin staining of paraffin-embedded sections. Scale bars = 100 µm. Data are representative of three independent experiments. (G) Changes in the disease activity indices (DAI) of DSS-exposed mice receiving si-negative/CH-NP or si-S100A9/CH-NP injections were assessed daily. Data are presented as mean ± standard deviations of values from six mice per group. *p<0.01 vs. control (two-tailed Student's t-test).

Similar articles

Cited by

References

    1. Podolsky DK. Inflammatory bowel disease (1). N Engl J Med. 1991;325:928–937. - PubMed
    1. Maloy KJ, Powrie F. Intestinal homeostasis and its breakdown in inflammatory bowel disease. Nature. 2011;474:298–306. - PubMed
    1. Kaser A, Zeissig S, Blumberg RS. Inflammatory bowel disease. Annu Rev Immunol. 2010;28:573–621. - PMC - PubMed
    1. Garud S, Peppercorn MA. Ulcerative colitis: current treatment strategies and future prospects. Therap Adv Gastroenterol. 2009;2:99–108. - PMC - PubMed
    1. Baumgart DC, Carding SR. Inflammatory bowel disease: cause and immunobiology. Lancet. 2007;369:1627–1640. - PubMed

Publication types

MeSH terms