. 2012;7(9):e43824.
doi: 10.1371/journal.pone.0043824. Epub 2012 Sep 4.

Ribavirin enhances the action of interferon-α against hepatitis C virus by promoting the p53 activity through the ERK1/2 pathway

Affiliations

Ribavirin enhances the action of interferon-α against hepatitis C virus by promoting the p53 activity through the ERK1/2 pathway

Wei-Liang Liu et al. PLoS One. 2012.

Abstract

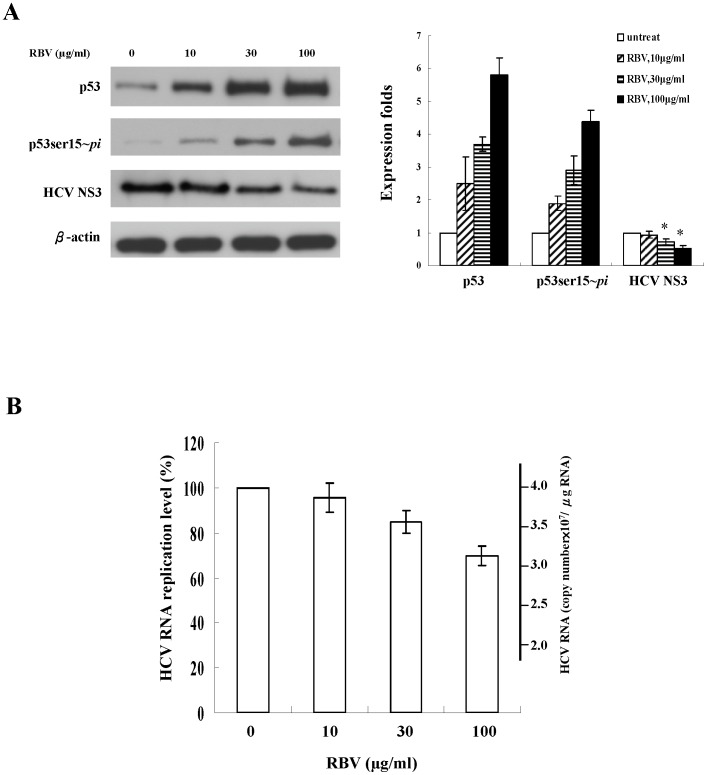
Background/aims: Ribavirin significantly enhances the antiviral response of interferon-α (IFN-α) against Hepatitis C virus (HCV), but the underlying mechanisms remain poorly understood. Recently, p53 has been identified as an important factor involving the suppression of HCV replication in hepatocytes. We, therefore, decided to investigate whether and how ribavirin inhibits the replication of HCV by promoting the activity of p53.

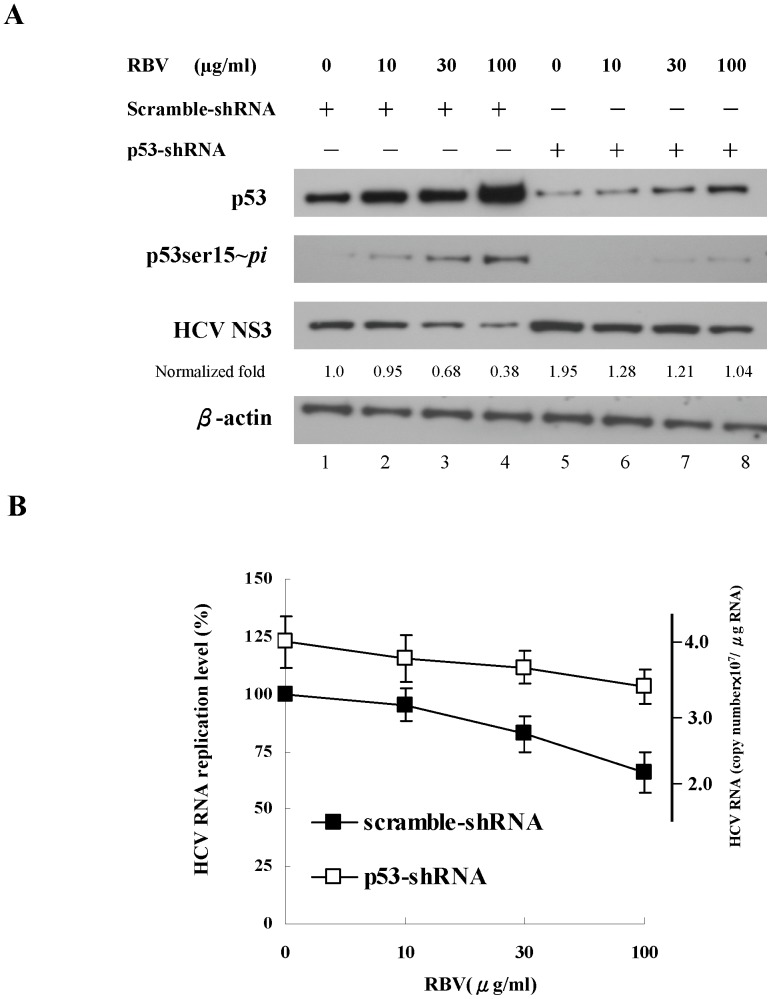
Methods: HepG2 and HCV replicons (JFH1/HepG2) were utilized to study the relationship between ribavirin and p53. The effect of ribavirin on cell cycles was analyzed by flow cytometry. The activation of p53 and the signaling pathways were determined using immunoblotting. By knocking down ERK1/ERK2 and p53 utilizing RNA interference strategy, we further assessed the role of ERK1/2 and p53 in the suppression of HCV replication by ribavirin in a HCV replicon system.

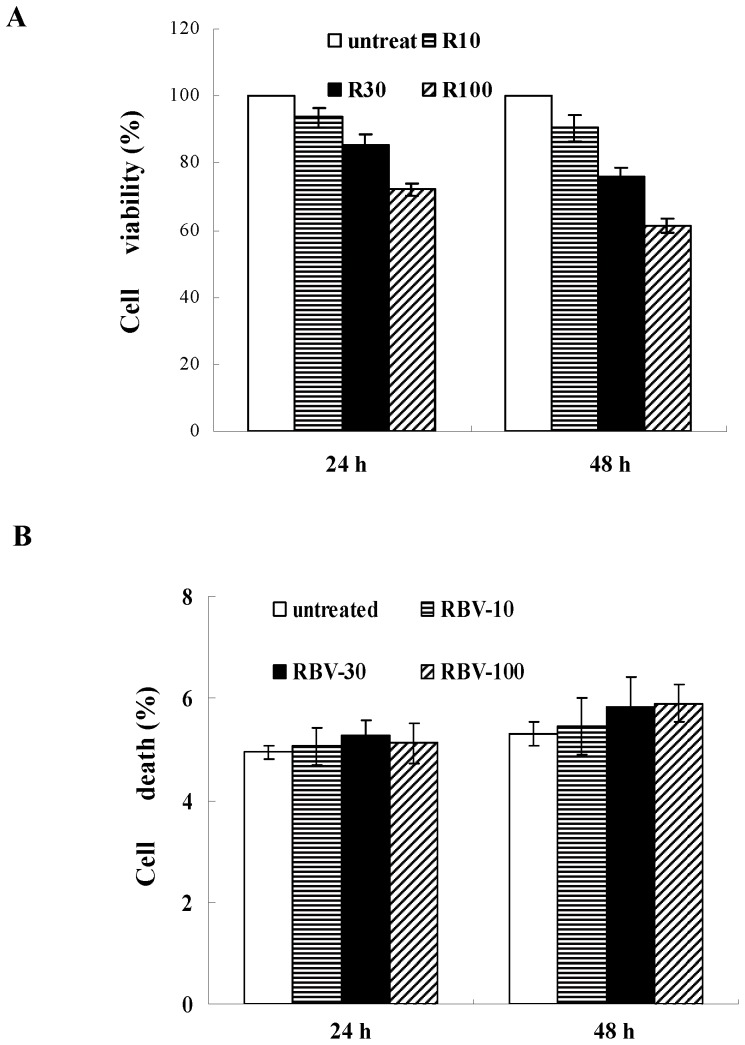
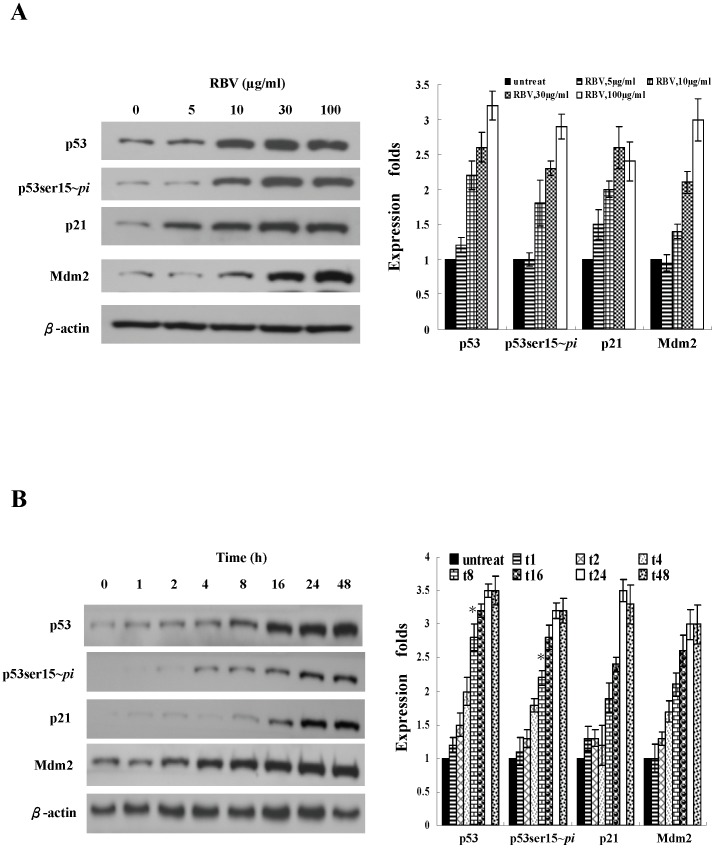
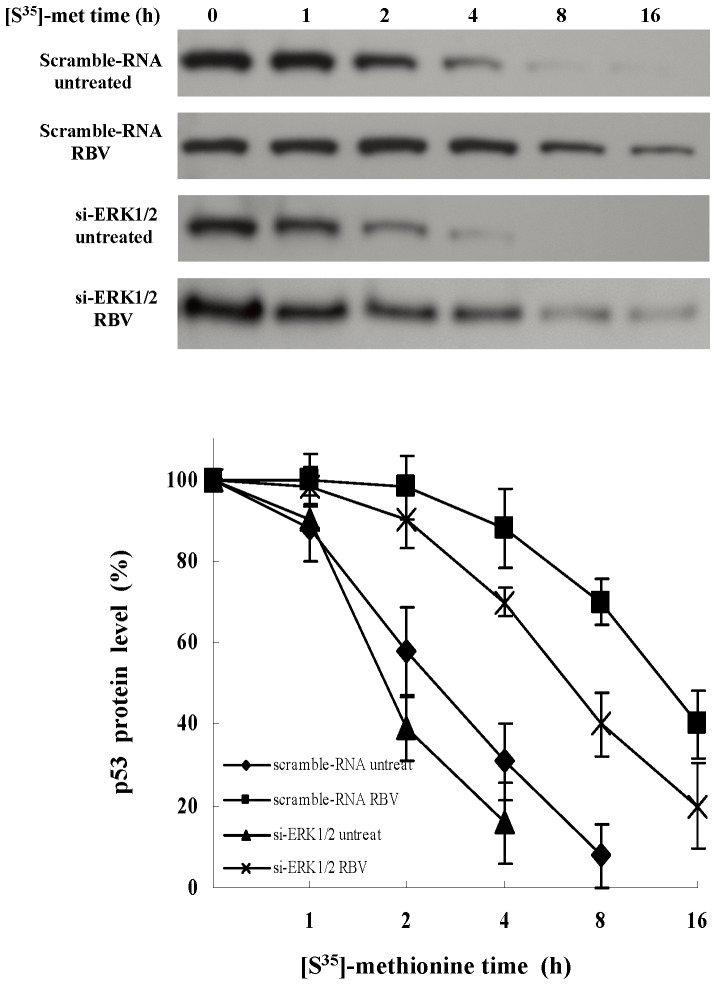
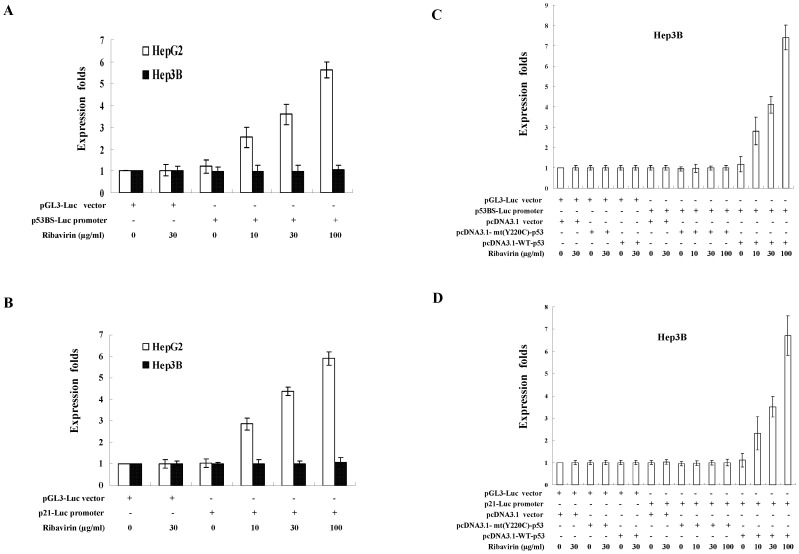
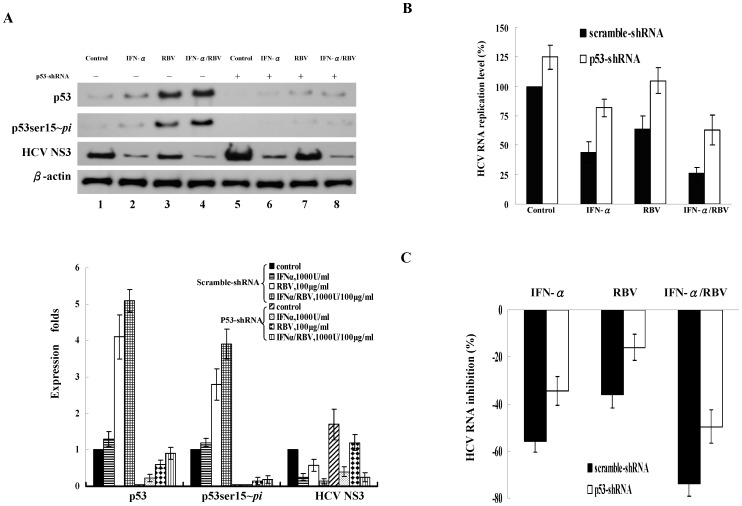
Results: Using HepG2 and HCV replicons, we demonstrated that ribavirin caused the cell cycle arrest at G1 phase and stabilized and activated p53, which was associated with the antiviral activity of ribavirin. Compared to either ribavirin or IFN-α alone, ribavirin plus IFN-α resulted in greater p53 activation and HCV suppression. We further identified ERK1/2 that linked ribavirin signals to p53 activation. More importantly, knockdown of ERK1/2 and p53 partially mitigated the inhibitory effects of ribavirin on the HCV replication, indicating that ERK1/2-p53 pathway was involved in the anti-HCV effects of ribavirin.

Conclusion: Ribavirin stimulates ERK1/2 and subsequently promotes p53 activity which at least partly contributes to the enhanced antiviral response of IFN-α plus ribavirin against HCV.


Conflict of interest statement

Competing Interests: The authors have declared that no competing interests exist.

Figures

Figure 1
Figure 1. Ribavirin inhibits cell proliferation in HepG2 cells.
(A) Cells were treated with the indicated amounts of ribavirin for 24 h and 48 h. The cells viability was determined by the MTT assay. (B) Cells were exposed to ribavirin for different time points and incubated with 5 µl FITC-conjugated Annexin V for 15 min in the dark at room temperature. Externalization of phosphatidylserine was identified by flow cytometry (FACScan). Data shown in (A) and (B) represent the mean ± s.e.m of five independent experiments. RBV-10: 10 µg/ml; RBV-30: 30 µg/ml; RBV-100: 100 µg/ml.
Figure 2
Figure 2. The profiles of cell cycle phases in ribavirin-treated cells.
HepG2 cells were treated with the (A) indicated doses of ribavirin (0∼100 µg/ml) for 24 h, or (B) with the 100 µg/ml ribavirin for indicated periods of time (0∼48 h). Cells were stained with propidium iodide and then subject to flow cytometric analysis to determine the effect of ribavirin on cell cycle distribution. The percentage of cells in G1, S, and G2/M phase of cell cycle and the percentage of cells in sub-G1 (apoptosis) peak were calculated using CellQuest software. Cells were also analyzed by immunoblotting for the cell cycle regulators: cdk2 and cyclin E. Indicated values are means ± s.e.m of three independent experiments, in each of which triplicate samples were measured. The G1 population of each group was compared to those of the reference groups which are untreated cells in (A) and 0 hour in (B). *, p = 0.04, **, p<0.01. RBV: ribavirin.
Figure 3
Figure 3. Ribavirin induces the p53 protein expression and phosphorylation.
(A) Dose-dependent expression and phosphorylation of p53 induced by ribavirin. HepG2 cells were treated with the indicated doses of ribavirin (0, 5, 10, 30, 100 µg/ml) for 24 h. (B) The time-course p53 expression during ribavirin treatment. HepG2 cells were treated with 30 µg/ml ribavirin and harvested at the indicated time points (0∼48 h). The cell extracts were subject to immunoblot analysis for phosphorylated p53 at Ser15 (p53ser15∼pi), p53, p21, Mdm2. The Western blot experiments were repeated for four times and the representative results are shown here. The band intensity of each protein in each experiment was determined by densitometry. The expression fold change of proteins were calculated by dividing the band intensity of the indicated proteins, normalized to that of the loading control β-actin, with that observed in the samples receiving no ribavirin treatment or at zero time of ribavirin treatment. The results are illustrated by the bar graph located on the right side of the Western blot analysis. Indicated values are means ± s.e.m of four independent experiments. RBV: ribavirin.
Figure 4
Figure 4. The half-life of p53.
The scrambled- and ERK1/2- siRNA transfected HepG2 cells were growing in the DMEM devoid of L-methionine for 3 h and then incubated with 200 µCi/ml of [S35]-methionine for 4 h. After removal of the medium, cells were treated with or without ribavirin (100 µg/ml) for the indicated times. At the end of the treatment period, cells were harvested and lysed. Total cell extracts were immunoprecipitated with anti-p53 antibody and subjected to SDS-PAGE for fluorography. The level of [S35]-labeled p53 was quantified. The data represented 4 independent experiments which gave similar results. RBV: ribavirin.
Figure 5
Figure 5. The p53-dependent transcriptional activity enhanced by ribavirin.
HepG2 and Hep3B (p53-deficient) cells were transfected with (A) p53BS-Luc reporter or (B) p21-Luc reporter After transfection, cells were treated with the indicated concentration of ribavirin for 24 h. The pRL-TK plasmid was co-transfected for the purpose of normalization. (C) p53BS-Luc reporter or (D) p21-Luc reporter was co-transfected with either wild-type p53-expression vector, mutant p53 (Y220C) or the control vector pcDNA3.1 into Hep3B cells. Cells were then treated with indicated concentrations of ribavirin for 24 hours. The expression folds in (A)∼(D) were shown compared to that observed with the control reporter pGL3-Luc vector, after normalization with expression levels of the internal control pRL-TK. Each result represent the mean ± s.e.m of three independent experiments, in each of which triplicate samples were measured.
Figure 6
Figure 6. The effect of ribavirin on HCV replication in HCV replicons.
(A) Replicons were treated with the indicated concentration of ribavirin for 48 h. The expression of total p53, phosphorylated p53 at Ser15 (p53ser15∼pi) and HCV NS3 viral proteins was analyzed by immunoblotting. The experiment was independently repeated 5 times and one representative result was shown here. The band intensity of each protein in each experiment was determined by densitometry. The expression fold change of proteins were calculated by dividing the band intensity of the indicated proteins, normalized to that of the loading control β-actin, with that observed in the samples receiving no ribavirin treatment. The results are illustrated by the bar graph located on the right side of the Western blot analysis. Each result represents the mean ± s.e.m of 5 independent measurements and was considered statistically significant at P<0.05. The HCV NS3 protein of each group was compared to those of the reference groups which are untreated cells. *, p<0.05. (B) HCV RNA levels were determined by quantitative RT-PCR. Each result represents the mean ± s.e.m of 5 independent measurements and was considered statistically significant at P<0.05 versus the untreated group. RBV: ribavirin.
Figure 7
Figure 7. The impact of p53 silencing on HCV replication in replicon cells.
Lentiviral vector-mediated silencing of endogenous p53 in replicon cells (JFH1/HepG2) treated with the indicated concentration of ribavirin for 48 h. (A) The expression of total p53, phosphorylated p53 at Ser15 (p53ser15∼pi) and HCV NS3 viral proteins was analyzed by immunoblotting. The Western blot was independently repeated five times and one representative result was shown here. The band intensity of each protein in each experiment was determined by densitometry. The expression level change of proteins were calculated by dividing the band intensity of the indicated proteins, normalized to that of the loading control β-actin, with that observed in the samples receiving scramble-shRNA treatment. (B) HCV RNA levels were measured by quantitative RT-PCR. Each result represents the mean ± s.e.m. of 5 independent determinations and is considered significant at P<0.05. RBV: ribavirin.
Figure 8
Figure 8. The effect of ribavirin (RBV) combined with IFN-α on p53 activity and the suppression of HCV replication.
The scrambled-shRNA and p53-shRNA transduced replicon cells (JFH1/HepG2) were treated with IFN-α (1000 U/ml), RBV (100 µg/ml) or the combined treatment with IFN-α and RBV for 48 h. (A) The expression of total p53, phosphorylated p53 at Ser15 (p53ser15∼pi) and HCV NS3 viral protein was analyzed by immunoblotting. The Western blot was independently repeated five times and one representative result was shown here. Levels of p53, phosphorylated p53 and HCV NS3 were quantified by densitometry analysis. The expression fold change of proteins were calculated by dividing the band intensity of the indicated proteins, normalized to that of the loading control β-actin, by that observed in the samples receiving scramble-shRNA treatment. (B) HCV RNA replication levels were determined by quantitative RT-PCR. (C) The percentage of HCV RNA inhibition was calculated as the HCV RNA levels of individual samples (IFN, RBV or IFN/RBV-treated samples) subtracted those of control samples (untreated samples) and then was divided by those of control samples using the data from (B). Each result represents the mean ± s.e.m. of 5 independent determinations and is considered significant at P<0.05. Control: untreated, IFN: INF-α, RBV: ribavirin.
Figure 9
Figure 9. Induction of ERK1/2 phosphorylation by ribavirin correlated with p53 phosphorylation and suppression of HCV replication.
(A) Dose-dependent phosphorylation of ERK1/2 by ribavirin. HepG2 cells were treated for 24 h with the indicated doses of ribavirin. (B) The association of ribavirin-induced ERK1/2 phosphorylation with p53 phosphorylation in a time-course analysis. HepG2 cells were untreated or treated with 30 µg/ml ribavirin and then harvested at the indicated time points. In addition, we used small-interference RNA (siRNA) to knockdown ERK1/ERK2 to assess the role of ERK1/2 and p53 in the suppression of HCV replication. (C) Cells were transduced with ERK1/2-siRNA (100 nM) and scrambled-siRNA for 48 h and treated with ribavirin (100 µg/ml) for 24 h in HCV replicon cells (JFH1/HepG2) and HepG2 cells. Cells were lysed, and analyzed for the expression of phosphorylated ERK1/2 (ERK1/2∼pi), phosphorylated p53 at Ser15 (p53ser15∼pi), p53, ERK1/2, Mdm2 and HCV NS3 proteins by immunoblotting. (D) HCV RNA expression levels of scramble-siRNA- or si-ERK1/2-transduced cells with/without ribavirin treatment were determined using quantitative RT-PCR. Each result represents the mean ± s.e.m of 5 independent measurements and is considered statistically significant at P<0.05. Control: no ribavirin treatment, RBV: ribavirin.

Similar articles

Cited by

References

    1. Graci JD, Cameron CE (2006) Mechanisms of action of ribavirin against distinct viruses. Rev Med Virol 16: 37–48. - PMC - PubMed
    1. Pawlotsky JM, Dahari H, Neumann AU, Hezode C, Germanidis G, et al. (2004) Antiviral action of ribavirin in chronic hepatitis C. Gastroenterology 126: 703–714. - PubMed
    1. Bodenheimer HC Jr, Lindsay KL, Davis GL, Lewis JH, Thung SN, et al. (1997) Tolerance and efficacy of oral ribavirin treatment of chronic hepatitis C: A multicenter trial. Hepatology 26: 473–477. - PubMed
    1. Zhou S, Liu R, Baroudy BM, Malcolm BA, Reyes GR (2003) The effect of ribavirin and IMPDH inhibitors on hepatitis C virus subgenomic replicon RNA. Virology 310: 333–342. - PubMed
    1. Reyes GR (2001) Ribavirin: recent insights into antiviral mechanisms of action. Curr Opin Drug Dev 4: 651–656. - PubMed

Publication types

MeSH terms