

The impact of infection on population health: results of the Ontario burden of infectious diseases study
- PMID: 22962601
- PMCID: PMC3433488
- DOI: 10.1371/journal.pone.0044103
The impact of infection on population health: results of the Ontario burden of infectious diseases study
Abstract
Background: Evidence-based priority setting is increasingly important for rationally distributing scarce health resources and for guiding future health research. We sought to quantify the contribution of a wide range of infectious diseases to the overall infectious disease burden in a high-income setting.
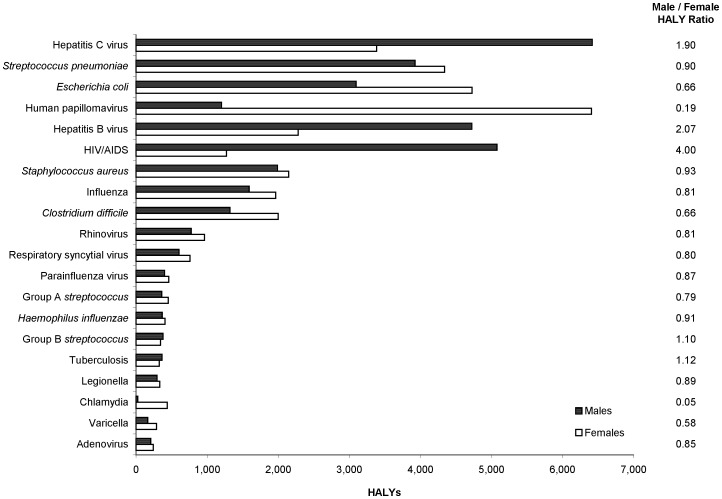
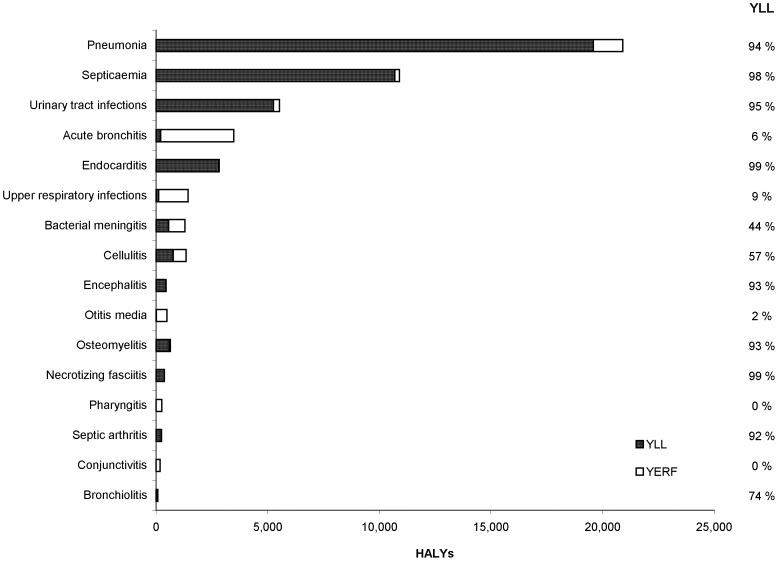
Methodology/principal findings: We used health-adjusted life years (HALYs), a composite measure comprising premature mortality and reduced functioning due to disease, to estimate the burden of 51 infectious diseases and associated syndromes in Ontario using 2005-2007 data. Deaths were estimated from vital statistics data and disease incidence was estimated from reportable disease, healthcare utilization, and cancer registry data, supplemented by local modeling studies and national and international epidemiologic studies. The 51 infectious agents and associated syndromes accounted for 729 lost HALYs, 44.2 deaths, and 58,987 incident cases per 100,000 population annually. The most burdensome infectious agents were: hepatitis C virus, Streptococcus pneumoniae, Escherichia coli, human papillomavirus, hepatitis B virus, human immunodeficiency virus, Staphylococcus aureus, influenza virus, Clostridium difficile, and rhinovirus. The top five, ten, and 20 pathogens accounted for 46%, 67%, and 75% of the total infectious disease burden, respectively. Marked sex-specific differences in disease burden were observed for some pathogens. The main limitations of this study were the exclusion of certain infectious diseases due to data availability issues, not considering the impact of co-infections and co-morbidity, and the inability to assess the burden of milder infections that do not result in healthcare utilization.
Conclusions/significance: Infectious diseases continue to cause a substantial health burden in high-income settings such as Ontario. Most of this burden is attributable to a relatively small number of infectious agents, for which many effective interventions have been previously identified. Therefore, these findings should be used to guide public health policy, planning, and research.
Conflict of interest statement
Figures
References
-
- Lopez AD, Mathers CD, Ezzati M, Jamison DT, Murray CJL (2006) Global Burden of Disease and Risk Factors. Washington DC: The International Bank for Reconstruction and Development/Oxford University Press. 425 p. - PubMed
-
- Public Health Group, Rural and Regional Health and Aged Care Services Division (2005) Victorian Burden of Disease Study: Mortality and morbidity in 2001. Melbourne, Victoria: Public Health Group, Rural and Regional Health and Aged Care Services Division. Victorian Government Department of Human Services.
Publication types
MeSH terms
Grants and funding
LinkOut - more resources
Full Text Sources
Medical
