

Soil fertilization leads to a decline in between-samples variability of microbial community δ13C profiles in a grassland fertilization experiment
- PMID: 22962602
- PMCID: PMC3433468
- DOI: 10.1371/journal.pone.0044203
Soil fertilization leads to a decline in between-samples variability of microbial community δ13C profiles in a grassland fertilization experiment
Abstract
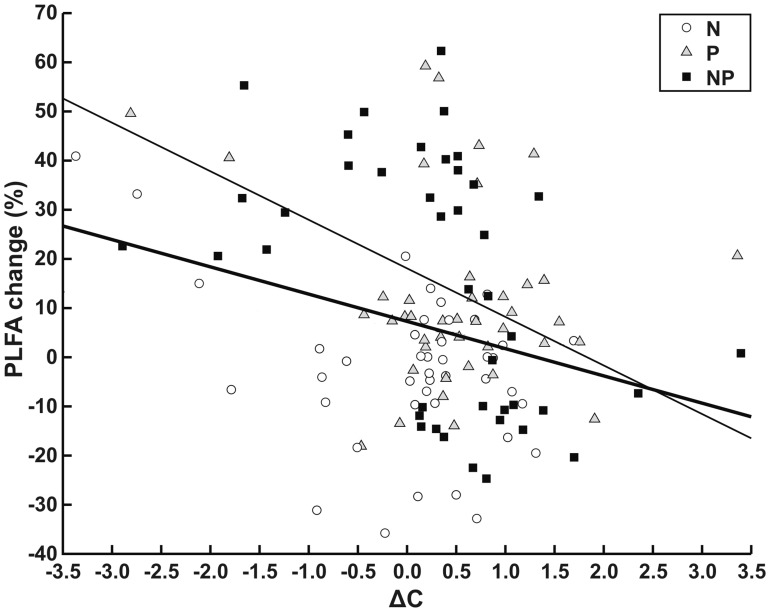
Gas chromatography combustion isotope ratio mass spectrometry (GC-C-IRMS) was used to measure the (13)C/(12)C ratios of PLFAs at natural abundance levels from a temperate grassland nitrogen (N) and phosphorus (P) factorial fertilization experiment in northern Greece. In each plot two rhizosphere samples were derived centred around individual Agrostis capillaris and Prunella vulgaris plants. It was hypothesized that the isotopic signal of microbes that preferentially feed on recalcitrant litter such as fungi would be modified by fertilization more strongly than that of opportunistic microbes using labile C. Microbial community δ(13)C was affected by both P and N fertilization regime and plant species identity. However, we have been unable to detect significant nutrient effects on individual groups of microbes when analyzed separately in contrast to our original hypothesis. Intra-treatment variability, as evaluated from Hartley's F(max) tests in the five first PCA components axes as well as the size of the convex hulls in PCA scoreplots and Mahalanobis distances, was considerably higher in the non-fertilized controls. Moreover, a significant relationship was established between the change in PLFA abundances and their respective changes in δ(13)C for the aggregate of samples and those simultaneously fertilized with N and P. We conclude that use of compound specific isotope analysis in the absence of labelling represents a valuable and overlooked tool in obtaining an insight of microbial community functioning.
Conflict of interest statement
Figures


Similar articles
-
Soil microbial community composition closely associates with specific enzyme activities and soil carbon chemistry in a long-term nitrogen fertilized grassland.Sci Total Environ. 2019 Mar 1;654:264-274. doi: 10.1016/j.scitotenv.2018.11.031. Epub 2018 Nov 7. Sci Total Environ. 2019. PMID: 30445326
-
Microbial community structure and the relationship with soil carbon and nitrogen in an original Korean pine forest of Changbai Mountain, China.BMC Microbiol. 2019 Sep 13;19(1):218. doi: 10.1186/s12866-019-1584-6. BMC Microbiol. 2019. PMID: 31519147 Free PMC article.
-
Effects of fertilization and clipping on carbon, nitrogen storage, and soil microbial activity in a natural grassland in southern China.PLoS One. 2014 Jun 10;9(6):e99385. doi: 10.1371/journal.pone.0099385. eCollection 2014. PLoS One. 2014. PMID: 24914540 Free PMC article.
-
Stoichiometric plasticity of microbial communities is similar between litter and soil in a tropical rainforest.Sci Rep. 2017 Oct 2;7(1):12498. doi: 10.1038/s41598-017-12609-8. Sci Rep. 2017. PMID: 28970559 Free PMC article.
-
Forest Soil Bacteria: Diversity, Involvement in Ecosystem Processes, and Response to Global Change.Microbiol Mol Biol Rev. 2017 Apr 12;81(2):e00063-16. doi: 10.1128/MMBR.00063-16. Print 2017 Jun. Microbiol Mol Biol Rev. 2017. PMID: 28404790 Free PMC article. Review.
Cited by
-
Proteogenomic analyses indicate bacterial methylotrophy and archaeal heterotrophy are prevalent below the grass root zone.PeerJ. 2016 Nov 8;4:e2687. doi: 10.7717/peerj.2687. eCollection 2016. PeerJ. 2016. PMID: 27843720 Free PMC article.
References
-
- Staddon PL (2004) Carbon isotopes in functional soil ecology. Trends Ecol Evol 19: 148–154. - PubMed
-
- Weast RC (1978) CRC Handbook of Chemistry and Physics, 58th ed. Boca Raton (FL): CRC Press Inc. 2348 p.
-
- Lajtha K, Marshall JD (1994) Sources of variation in the stable isotopic composition of plants. In: Lajtha K, Marshall JD, editors. Stable isotopes in ecology and environmental science. London: Blackwell Scientific Publications, pp. 1–21.
-
- Zhang CL (2002) Stable carbon isotopes of lipid biomarkers: analysis of metabolites and metabolic fates of environmental microorganisms. Curr Opin Biotechnol 13: 25–30. - PubMed
-
- Demoling F, Figueroa D, Bååth E (2007) Comparison of factors limiting bacterial growth in different soils. Soil Biol Biochem 39: 2485–2495.
Publication types
MeSH terms
Substances
LinkOut - more resources
Full Text Sources
Medical
Miscellaneous
