. 2012;7(9):e44600.
doi: 10.1371/journal.pone.0044600. Epub 2012 Sep 4.

In vivo screening for secreted proteins that modulate glucose handling identifies interleukin-6 family members as potent hypoglycemic agents

Affiliations

In vivo screening for secreted proteins that modulate glucose handling identifies interleukin-6 family members as potent hypoglycemic agents

Chen Amy Chen et al. PLoS One. 2012.

Erratum in

  • PLoS One. 2012;7(11). doi:10.1371/annotation/6e392eb7-55cb-4bc6-ab8e-bd8130ad6582. Carolan, Peter C [corrected to Carolan, Peter J]

Abstract

Diabetes is a disease of abnormal glucose homeostasis characterized by chronic hyperglycemia and a broad array of consequent organ damage. Because normal glucose homeostasis is maintained by a complex interaction between behavior (feeding and physical activity) and metabolic activity that is modulated by inter-organ signaling through secreted factors, disease modeling in vitro is necessarily limited. In contrast, in vivo studies allow complex metabolic phenotypes to be studied but present a barrier to high throughput studies. Here we present the development of a novel in vivo screening platform that addresses this primary limitation of in vivo experimentation. Our platform leverages the large secretory capacity of the liver and the hepatocyte transfection technique of hydrodynamic tail vein injection to achieve supraphysiologic blood levels of secreted proteins. To date, the utility of hydrodynamic transfection has been limited by the deleterious impact of the variable transfection efficiency inherent to this technique. We overcome this constraint by co-transfection of a secreted luciferase cDNA whose product can be easily monitored in the blood of a living animal and used as a surrogate marker for transfection efficiency and gene expression levels. To demonstrate the utility of our strategy, we screened 248 secreted proteins for the ability to enhance glucose tolerance. Surprisingly, interleukin-6 and several of its family members but not other well-recognized insulin sensitizing agents were identified as potent hypoglycemic factors. We propose this experimental system as a powerful and flexible in vivo screening platform for identifying genes that modulate complex behavioral and metabolic phenotypes.


Conflict of interest statement

Competing Interests: The authors have declared that no competing interests exist.

Figures

Figure 1
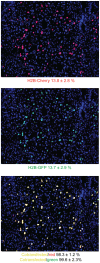
Figure 1. Hydrodynamic tail injection allows for hepatocyte co-transfection of multiple genes.
Tail vein injections were performed on 6-week old ICR mice with 250 µg of an H2B-Cherry transposable expression plasmid (top panel) and 25 µg of an H2B-GFP transposable expression plasmid (middle panel). The percentage of individually transfected and co-transfected hepatic cells was determined by image analysis of fixed hepatic sections. Co-localization was identified by the co-localization of red and green fluorescence (bottom panel). Greater than 1000 cells from multiple sections were counted from a representative animal. Standard deviations are shown.
Figure 2
Figure 2. Serum luciferase activity is a surrogate marker for hepatocyte transfection efficiency and circulating serum levels of proteins encoded by co-transfected expression constructs. A.
Serum luciferase levels and the percentage of transfected hepatocytes were determined in individual 6-week old ICR mice that had undergone hydrodynamic tail vein injection with GLuc (25 µg) and H2B-cherry (25 µg) expression plasmids 48 hours prior to analysis. B. Serum luciferase levels and IL-11 levels (r2 = 0.9293) were measured in 6-week old ICR mice that had undergone hydrodynamic tail vein injection with GLuc (25 µg) and IL-11 (25 µg) expression plasmids 48 hours prior to analysis.
Figure 3
Figure 3. Serum luciferase activity is influenced by both the amount and the complexity of cDNA expression constructs that are transfected into liver cells via hydrostatic tail vein injection. A.
Serum luciferase levels were measured 48 hours after 6-week old ICR mice (n = 5 animals per group) underwent hydrostatic tail vein injection with the indicated amount of the GLuc expression construct. B. Serum luiciferase levels were measured 48 hours after 6-week old ICR mice (n = 5 animals per group) underwent hydrostatic tail vein injection with GLuc (25 µg) and variable amounts (0, 75, 175 or 250 µg) of unrelated pT3 expression constructs. ** Indicates p<0.01 using a paired t-test.
Figure 4
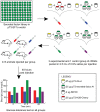
Figure 4. Development of an in vivo screening protocol.
A Gateway ready arrayed library of 248 factors (left, top panel) were transferred into the transposable pT3 expression vector and isolated for injection. For each round of injection, a control DNA injection (GLuc (25 µg), SB100 (2 µg), and H2B-Cherry (75 µg)) and 3 experimental DNA injection formulations (GLuc (25 µg), SB100 (2 µg), and 3 secreted factors (25 µg each)) were prepared (right, top panel). Each cohort of 5 mice (aged 6–7 weeks) were injected with a single DNA formulation (left, middle panel). 43 h post-injection, mice were weighed and fasted. At 48 hours, animals underwent an i.p. glucose tolerance test with plasma glucose monitoring at times 0, 37.5 and 60 minutes. Subsequently, serum luciferase levels were determined to exclude mice with unsuccessful tail vein injections (luciferase values <30,000 relative light units). Sample results are illustrated in the left lower panel where the three potential outcomes are observed: improved glucose tolerance (blue formulation), worsened glucose tolerance (green formulation), and no effect (purple formulation).
Figure 5
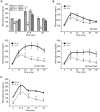
Figure 5. In vivo screening for secreted factors that enhance glucose tolerance identified interleukin-6. A.
Glucose tolerance tests were performed on a cohort of mice (n = 4 animals per group) undergoing primary screening (1 control group and 3 experimental groups) for genes that modulate the glucose tolerance test. The second group contained the IL-6 ORF in addition to two other factors. ** Indicates p<0.01 using a paired t-test. B. Glucose tolerance tests were performed 48 hours post tail vein injection on 6 mice that received either GLuc (25 µg) and H2B-Cherry (25 µg), or GLuc and IL-6 (25 µg). Mice underwent no fast (right, upper panel, n = 5 animals per group), a 5 hour fast (left, lower panel, n = 5 animals per group) or an overnight fast (right, lower panel, n = 4 animals per group). *Indicates p<0.05 using a paired t-test. ** Indicates p<0.01 using a paired t-test. C. Glucose tolerance tests were performed 7 days post tail vein injection on mice that received either GLuc (25 µg) and H2B-cherry (25 µg), or GLuc and IL-6 (25 µg) (n = 5 animals per group). Animals were fasted for 5 hours prior to performing the GTT. *Indicates p<0.05 using a paired t-test. ** Indicates p<0.01 using a paired t-test.
Figure 6
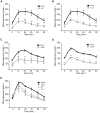
Figure 6. Several IL-6 family members enhance glucose tolerance.
Glucose tolerance tests were performed 2 days post tail vein injection on mice that received either GLuc (25 µg) and H2B-cherry (25 µg), or: A. GLuc and LIF (25 µg) (n = 7 animals per group). B. GLuc and CT-2 (25 µg) (n = 7 animals per group). C. GLuc and OSM (25 µg) (n = 6 animals per group). D. GLuc and CNTF (25 µg) (n = 10 animals per group). All animals were fasted for 5 hours prior to the GTT. * Indicates p<0.05 using a paired t-test. ** Indicates p<0.01 using a paired t-test. E. Glucose tolerance testing was performed on 5-hour fasted animals that were injected i.p. with the indicated recombinant factor (n = 4) at time –30 minutes and then gavaged with a glucose solution (2g/kg) at time 0 minutes. Compared to saline treated animals, glucose values were significantly lower (p<0.04) for all experimentally treated animals at 15, 30, 45, 60 and 90 minutes (except CT-1 at 90 minutes).

Similar articles

Cited by

References

    1. Danaei G, Finucane MM, Lu Y, Singh GM, Cowan MJ, et al. (2011) National, regional, and global trends in fasting plasma glucose and diabetes prevalence since 1980: systematic analysis of health examination surveys and epidemiological studies with 370 country-years and 2.7 million participants. Lancet 378: 31–40. - PubMed
    1. Seidell JC (2000) Obesity, insulin resistance and diabetes–a worldwide epidemic. Br J Nutr 83 Suppl 1: S5–8. - PubMed
    1. Curioni CC, Lourenco PM (2005) Long-term weight loss after diet and exercise: a systematic review. Int J Obes (Lond) 29: 1168–1174. - PubMed
    1. Tong PC, Ko GT, So WY, Chiang SC, Yang X, et al. (2008) Use of anti-diabetic drugs and glycaemic control in type 2 diabetes-tThe Hong Kong Diabetes Registry. Diabetes Res Clin Pract 82: 346–352. - PubMed
    1. Wing RR, Venditti E, Jakicic JM, Polley BA, Lang W (1998) Lifestyle intervention in overweight individuals with a family history of diabetes. Diabetes Care 21: 350–359. - PubMed

Publication types

MeSH terms