. 2012 Aug 30;116(34):18440-18450.
doi: 10.1021/jp303267y. Epub 2012 Jul 18.

Lipid Nanoparticles Containing siRNA Synthesized by Microfluidic Mixing Exhibit an Electron-Dense Nanostructured Core

Free PMC article

Lipid Nanoparticles Containing siRNA Synthesized by Microfluidic Mixing Exhibit an Electron-Dense Nanostructured Core

Alex K K Leung et al. J Phys Chem C Nanomater Interfaces. .
Free PMC article

Abstract

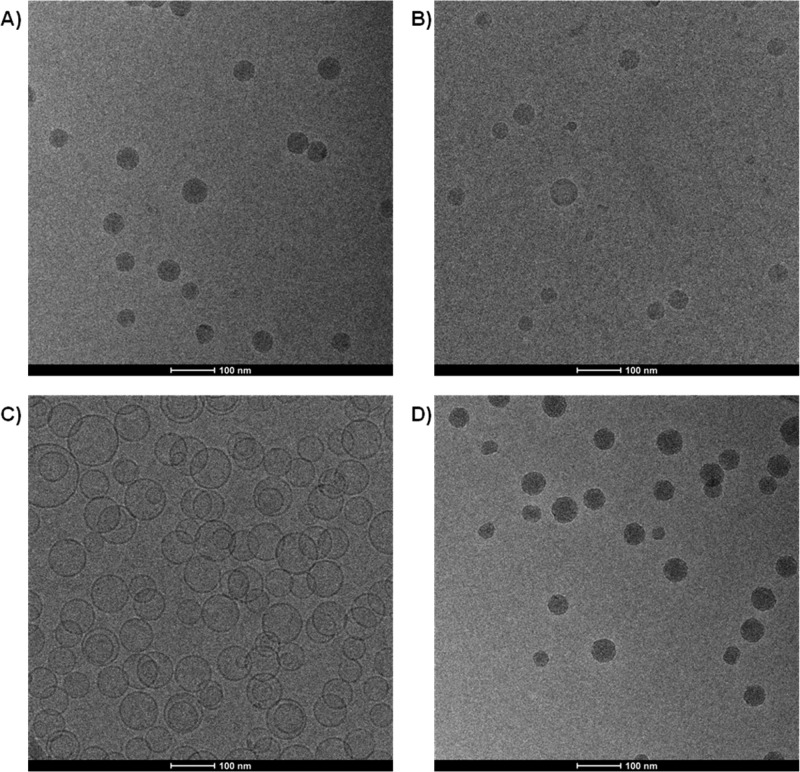
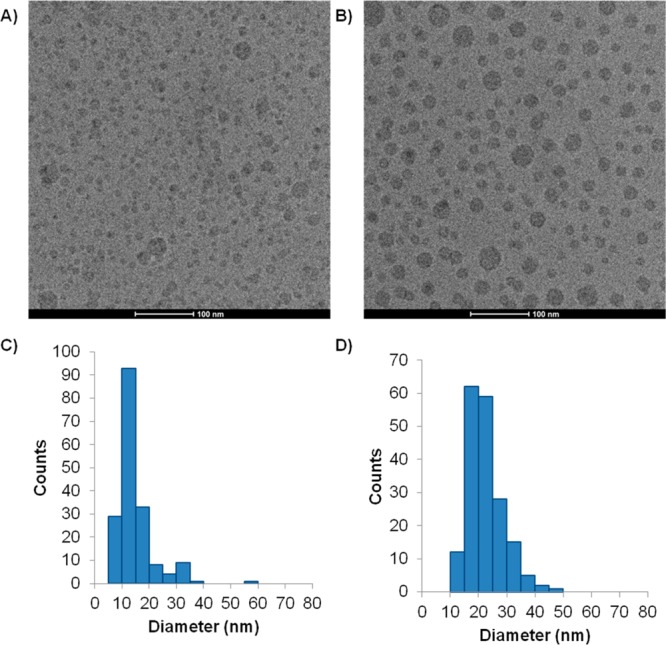
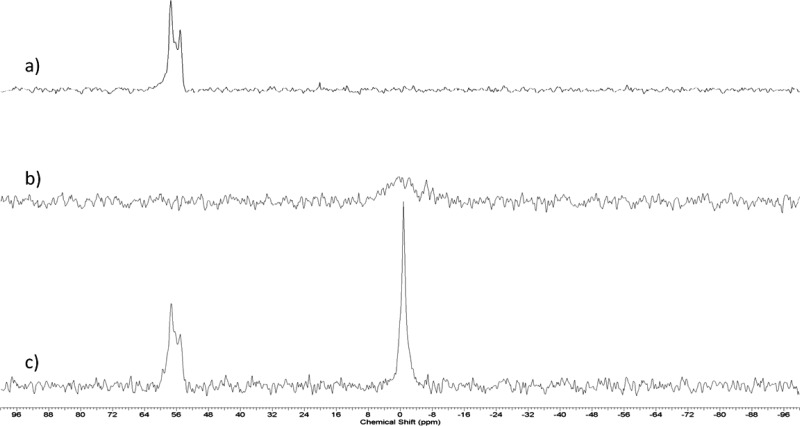
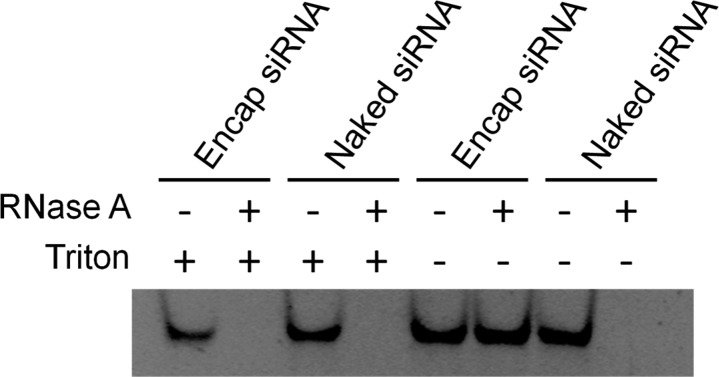
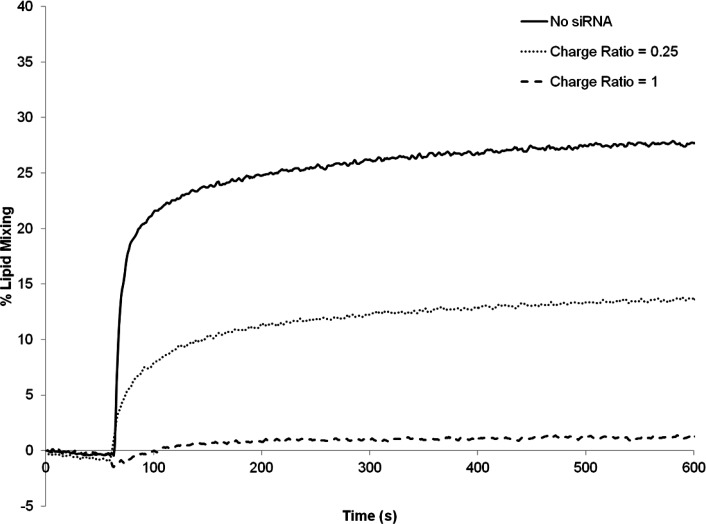
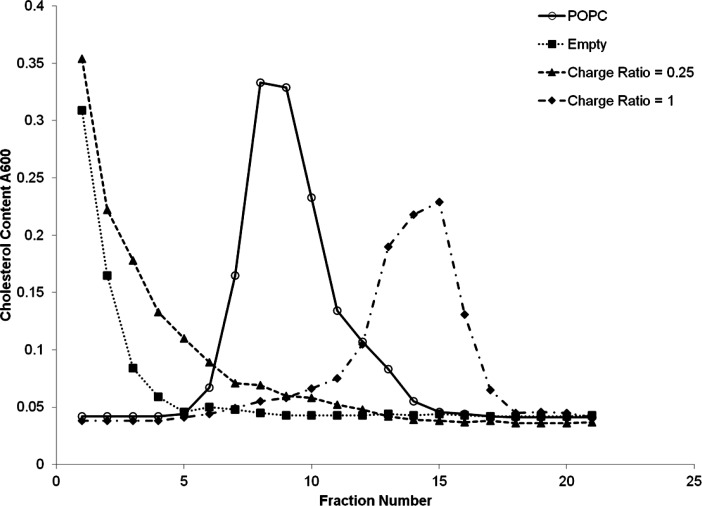
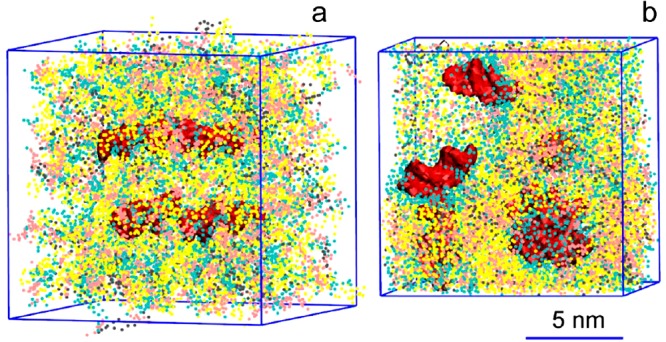
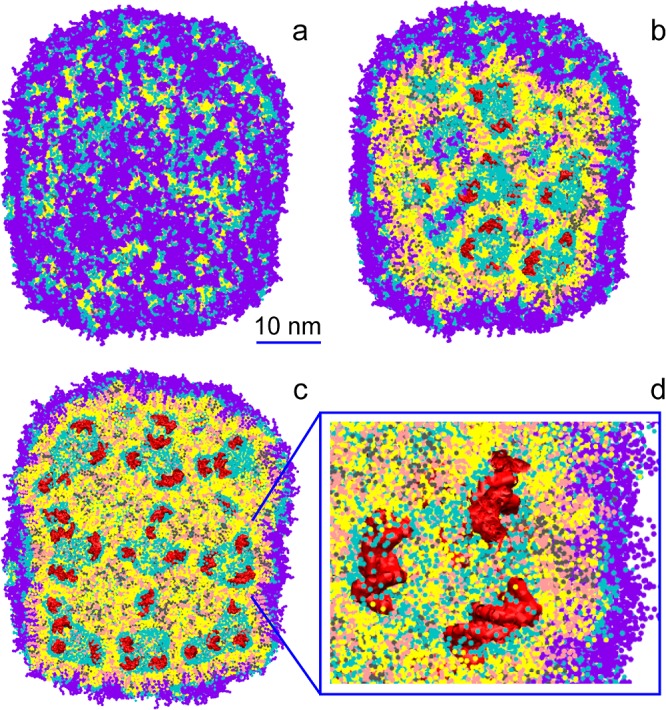
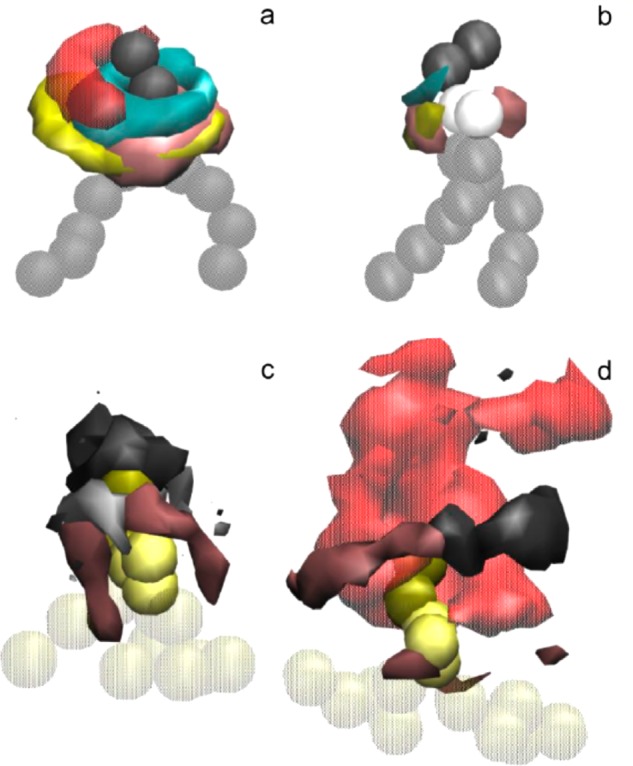
Lipid nanoparticles (LNP) containing ionizable cationic lipids are the leading systems for enabling therapeutic applications of siRNA; however, the structure of these systems has not been defined. Here we examine the structure of LNP siRNA systems containing DLinKC2-DMA(an ionizable cationic lipid), phospholipid, cholesterol and a polyethylene glycol (PEG) lipid formed using a rapid microfluidic mixing process. Techniques employed include cryo-transmission electron microscopy, (31)P NMR, membrane fusion assays, density measurements, and molecular modeling. The experimental results indicate that these LNP siRNA systems have an interior lipid core containing siRNA duplexes complexed to cationic lipid and that the interior core also contains phospholipid and cholesterol. Consistent with experimental observations, molecular modeling calculations indicate that the interior of LNP siRNA systems exhibits a periodic structure of aqueous compartments, where some compartments contain siRNA. It is concluded that LNP siRNA systems formulated by rapid mixing of an ethanol solution of lipid with an aqueous medium containing siRNA exhibit a nanostructured core. The results give insight into the mechanism whereby LNP siRNA systems are formed, providing an understanding of the high encapsulation efficiencies that can be achieved and information on methods of constructing more sophisticated LNP systems.


Figures

Figure 1
Figure 1
LNP containing DLinKC2-DMA exhibit electron dense cores both in the presence and absence of encapsulated siRNA as indicated by cryo-TEM. LNP were prepared by microfluidic mixing employing a herringbone mixer as indicated in the Experimental Section. POPC/cholesterol (50/50; mol/mol) bilayer vesicles were prepared by extrusion through polycarbonate filters with 80 nm pore size. (A) Cryo-TEM micrograph obtained from LNP siRNA with lipid composition DLinKC2-DMA/DSPC/Chol/PEG-lipid (40/11.5/47.5/1; mol/mol) and siRNA at a siRNA/lipid ratio of 0.06, wt/wt, corresponding to an siRNA/cationic lipid charge ratio of 0.25. (B) LNP with the same lipid composition as for (A) but prepared at an siRNA/lipid ratio of 0.24 wt/wt, corresponding to an siRNA/cationic lipid charge ratio of 1. (C) Cryo-TEM micrograph of POPC/cholesterol (1:1) vesicles. (D) LNP with the same lipid composition as for (A) and (B) but prepared in the absence of siRNA.
Figure 2
Figure 2
LNP exhibit limit sizes consistent with inverted micelle structure in presence and absence of siRNA. Limit size LNP were prepared by microfluidic mixing as indicated in the Experimental Section. (A) Cryo-TEM micrograph obtained from LNP with lipid composition DLinKC2DMA/PEG-lipid (90/10; mol/mol) in the absence of siRNA. (B) LNP with the same composition as for (A) but prepared with siRNA at an siRNA-to-cationic lipid charge ratio of 1. (C) Size distribution of LNPs in Figure 2A and (D) size distribution of LNPs in (B). Particle diameters are determined with the aid of Image J (NIH, Bethesda, MD), and average diameters are calculated from over 150 particles.
Figure 3
Figure 3
Encapsulated siRNA is immobilized on the NMR time scale. (A) 31P signal from free (phosphothioate) siRNA. Note that phosphothioate siRNA, which gives rise to a 31P NMR resonance ∼56 ppm downfield of the phosphodiester peak, was used to avoid overlap with the 31P NMR signal arising from the DSPC phosphorus. (B) 31P NMR spectrum of phosphothioate siRNA encapsulated at a siRNA/lipid ratio of 0.06 (w/w) in LNP containing DLinKC2-DMA/DSPC/Chol/PEG-lipid (40/11.5/47.5/1; mol/mol). (C) 31P NMR signal arising from the same sample as (B) after the addition of 1% SDS to solubilize the particle. The spectra depicted were obtained from 15 000 transients as described in the Experimental Section.
Figure 4
Figure 4
siRNA encapsulated in LNP is fully protected from external RNase. siRNA was either employed in the free form or encapsulated in LNP containing DLinKC2-DMA/DSPC/Chol/PEG-lipid (40/11.5/47.5/1; mol/mol) at an siRNA/lipid ratio of 0.06 (w/w). Encapsulation was performed using the microfluidic mixer as indicated in the Experimental Section. The integrity of the siRNA was challenged with 1 μg/mL bovine pancreatic RNase A. 5% Triton X-100 was added to solubilize the LNP. Gel electrophoresis was performed on 20% native polyacrylamide gel and siRNA visualized by staining with SYBR-Safe.
Figure 5
Figure 5
Cationic lipid is associated with internalized siRNA in LNP siRNA systems. The amount of external cationic lipid in LNP siRNA systems was assayed as a function of the siRNA phosphate-to-cationic lipid charge ratio using the FRET lipid mixing assay described in the Experimental Section. Three LNP systems DLinKC2-DMA/DSPC/Chol/PEG-lipid (40/11.5/47.5/1; mol/mol) were prepared at charge ratios of 0 (solid line), 0.25 (dotted line), and 1 (dash line). The lipid mixing assay was performed at pH 5.5 to ensure that essentially all external DLinKC2-DMA was positively charged. The reaction was initiated by injecting the LNP (at t = 30 s) into a stirred cuvette containing the anionic DOPS/NBD-PE/Rh-PE (98:1:1 molar ratio) vesicles.
Figure 6
Figure 6
The density of LNP siRNA systems is consistent with a hydrophobic lipid core as indicated by density gradient ultracentrifugation. A 1–15% sucrose step gradient was used as described in the Experimental Section. Fractions (500 μL) were successively removed from the top of gradient following centrifugation at 190 000g for 18 h and were assayed for cholesterol in POPC/cholesterol bilayer vesicles (open circles), empty LNP system (filled squares), LNP siRNA systems at a siRNA/cationic lipid charge ratios of 0.25 and 1 (filled triangles and filled diamonds, respectively).
Figure 7
Figure 7
Self-assembly from a random configuration (a) into a building block (b) for a lipid nanoparticle (LNP). A mixture of DLinKC2-DMA, DSPC and cholesterol (576 DLinKC2-DMAlipids, 144 DSPC lipids and 576 cholesterol molecules; 44/11/44; mol/mol) is placed in a small simulation box at a low hydration level; see text. DLinKC2-DMAis shown in yellow, cholesterol in pink, DSPC in gray, lipid polar moiety in cyan, and nucleic acids (12 bp duplex DNA) in red; water not shown for clarity.
Figure 8
Figure 8
A lipid nanoparticle (LNP) contains irregular water-filled cavities separated by bilayer membranes, with nucleic acids bound to membrane surfaces: side (a), cross-section (b,c), and zoom-in (d) views. Cationic lipid DLinKC2-DMAis shown in yellow, cholesterol in pink, DSPC in gray, lipid polar moiety in cyan, PEG-lipid in violet, and nucleic acids (duplex DNA) in red; water not shown for clarity. The lipid composition was DLinKC2-DMA/DSPC/cholesterol/PEG-lipid (4:1:4:1; mol/mol) and DNA to lipid ratio ∼0.05 wt/wt.
Figure 9
Figure 9
Spatial density distributions for selected molecular groups around DSPC in the LNP core (a) and on the LNP surface (b), and DLinKC2-DMAin the LNP core free (c) and bound to DNA (d). The surfaces of constant number densities are plotted at the values corresponding approximately to the average density in the first coordination shell. In the molecular representations, DSPC headgroup is shown as dark gray, glycerol-ester region as light gray, and hydrocarbon chains as transparent gray beads; DLinKC2-DMAheadgroup is shown as yellow, linker as light yellow, and chains as transparent yellow beads. In the density distributions, DNA phosphates are colored in semitransparent red, DLinKC2-DMAheadgroup in cyan and linker in yellow, cholesterol polar group in pink, DSPC headgroup in dark gray, and glycerol-ester in light gray.

References

    1. Zimmermann T. S.; Lee A. C. H.; Akinc A.; Bramlage B.; Bumcrot D.; Fedoruk M. N.; Harborth J.; Heyes J. A.; Jeffs L. B.; John M.; et al. Nature 2006, 441, 111. - PubMed
    1. Semple S. C.; Akinc A.; Chen J.; Sandhu A. P.; Mui B. L.; Cho C. K.; Sah D. W. Y.; Stebbing D.; Crosley E. J.; Yaworski E.; et al. Nat. Biotechnol. 2010, 28, 172. - PubMed
    1. Jeffs L. B.; Palmer L. R.; Ambegia E. G.; Giesbrecht C.; Ewanick S.; MacLachlan I. Pharm. Res. 2005, 22, 362. - PubMed
    1. Crawford R.; Dogdas B.; Keough E.; Haas R. M.; Wepukhulu W.; Krotzer S.; Burke P. a; Sepp-Lorenzino L.; Bagchi A.; Howell B. J. Int. J. Pharm. 2011, 403, 237. - PubMed
    1. Zhigaltsev I. V.; Maurer N.; Edwards K.; Karlsson G.; Cullis P. R. J. Controlled Release 2006, 110, 378. - PubMed

LinkOut - more resources