Review
. 2012 Oct 21;14(39):13469-86.
doi: 10.1039/c2cp41858d.

Advances in functional X-ray imaging techniques and contrast agents

Affiliations
Review

Advances in functional X-ray imaging techniques and contrast agents

Hongyu Chen et al. Phys Chem Chem Phys. .

Abstract

X-rays have been used for non-invasive high-resolution imaging of thick biological specimens since their discovery in 1895. They are widely used for structural imaging of bone, metal implants, and cavities in soft tissue. Recently, a number of new contrast methodologies have emerged which are expanding X-ray's biomedical applications to functional as well as structural imaging. These techniques are promising to dramatically improve our ability to study in situ biochemistry and disease pathology. In this review, we discuss how X-ray absorption, X-ray fluorescence, and X-ray excited optical luminescence can be used for physiological, elemental, and molecular imaging of vasculature, tumors, pharmaceutical distribution, and the surface of implants. Imaging of endogenous elements, exogenous labels, and analytes detected with optical indicators will be discussed.


Figures

Figure 1
Figure 1
Diagram depicting the possible interactions between X-rays and a sample for various different X-ray techniques.
Figure 2
Figure 2
Schematic showing projection X-ray imaging.
Figure 3
Figure 3
Schematic showing the three phase process of the formation of a CT image.
Figure 4
Figure 4
Mass attenuation coefficients for various elements and tissues as a function of photon energy (on a log-log scale). (B: bone, M: muscle, F: fat). The vertical lines show the typical region used for X-ray projection imaging and CT. Note the mass weighed attenuation coefficient is equal to the linear coeffficient divided by the density. Reproduced with permission from Ref. .
Figure 5
Figure 5
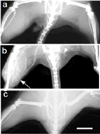
X-ray images of mouse hind legs in vivo. (a) Before injection; (b) 2 min. post tail vein injection of gold nanoparticles; (c) 2 min. after equal weight of iodine contrast agent (Omnipaque). Arrow points to leg with tumor and increased vascularity. Arrowhead points to 0.1 mm diameter vessel. Scale bar represents 5 mm. Reproduced with permission from Ref. .
Figure 6
Figure 6
In vivo X-ray CT volume-rendered images of (A) a mouse before GNP injection, (B) a mouse 6 hours post injection of non-specific IgG GNP as a passive targeting experiment, and (C) a mouse 6 hours post injection of anti EGFR coated GNP that specifically targeted the SCC head and neck tumor. The anti-EGFR targeted GNP shows clear contrast enhancement of the tumor (C, yellow arrow), which was undetectable without the GNP contrast agents (A, yellow arrow). CT numbers represents the average HU of the whole tumor area. All scans were performed using a clinical CT at 80 kVp, 500 mAs, collimation 0.625×64 mm and 0.521 pitch size (A 64-detector CT scanner, LightSpeed VCT, GE Medical Systems). Reproduced with permission from Ref. .
Figure 7
Figure 7
K-shell fluorescence yield for all K-shell transitions determined by theoretical calculations of Massey and Burhop, Rubenstein, Callan, McGuire, Kostroun, Chen and Craseman, and Walters and Bhalla. Reproduced with permission from Ref. .
Figure 8
Figure 8
(i.) X-ray transmission microtomographies of (a) cancerous and (e) healthy breast tissue in the same patient. (1) (b)– (d) and (f) – (h) show X-ray fluorescence microtomographies of cancerous and healthy breast tissue respectively. The scale bar is 2 mm. (ii.) 3-Dimensional XRF μCT images of (a) healthy breast tissue, (b) iron (c) copper and (d) zinc showing the heterogeneous distribution of metal ion content. Reproduced with permission from Ref. .
Figure 9
Figure 9
Schematic of an X-ray fluorescence microscope with a Fresnel zone plate for beam focusing, and energy dispersive detector for multi-element analysis. Reproduced with permission from Ref. .
Figure 10
Figure 10
Intensity-weighted elemental maps of phosphorus, sulfur, calcium, iron, copper, zinc, and potassium in an MDCK cell incubated with a Gadolinium (III) contrast agent (Gadolinium (III) (4,7,1-Triscarboxymethyl-6-[4-(3-{4-[2-(4-Dimethylaminophenyl)vinyl] phenyl)-thioureido)benzyl]-1,4,7,10-Tetraazacyclododec-1-yl}-acetic acid). Reproduced with permission from Ref. .
Figure 11
Figure 11
Schematic of a confocal 3D XRF configuration. Reproduced with permission from Ref. .
Figure 12
Figure 12
(a) X-ray fluorescence spectrum and schematic of experimental set-up for the detection of 100 nM ssDNA with synthesized lead-tin alloy nanoparticles, (b) Plot of peak area vs. concentration for the Lα1 represented in black with a higher sensitivity than the Lβ1 line of lead represented in red. (c) Schematic of experimental set-up. Reproduced with permission from Ref. .
Figure 13
Figure 13
(A) Schematic of a scanning luminescence X-ray microscope (SLXM) configured for luminescence detection using an avalanche photodiode. (B) SLXM image of actin filmaents in a 3T3 fiberblast labelled with a Tb-polychelated secondary antibody bound to anti-actin. Reproduced with permission from Ref. .
Figure 14
Figure 14
Schematic showing the principle of XLCT. A computer-controlled collimated X-ray beam selectively excites the sample while photo-detectors measure the light coming out. Inset figure shows the X-ray excited luminescence of X-ray phosphor (Gd2O2S:Eu). Reproduced with permission from Ref. .
Figure 15
Figure 15
Numerical simulation of a limited angle XLT detection of a 6 mm diameter object buried at varying depths beneath the tissue surface. The object is labeled with varying scintillator concentrations as indicated. The y-axis shows the required X-ray dose to achieve a signal/noise ratio of 10. Reproduced with permission from Ref. .
Figure 16
Figure 16
High-resolution XEOL imaging through tissue. Green X-ray scintillators (Gd2O2S:Tb) and red scintillators (Gd2O2S:Eu) were deposited as a film with a sharp interface between the red and green sections. The film was irradiated by a narrow rectangular X-ray beam, and a photograph of the luminescence was acquired at a series of sample positions (20 µm steps). (A) Setup schematic, (B) setup photograph, (C) Ratio of red to green light intensity scanned at different positions (20 µm step size) with/without 10 mm of tissue. (D, E, F) photos of luminescence (with room light blocked) as the sample was moved across the red/green (Tb/Eu) phosphor interface, at displacements of 0.12, 0.22, and 0.42 mm, respectively. (G, H, I) correspond to the same position of D, E, and F, respectively, but with the film inserted into chicken breast. The luminescent image is blurred by the scattering in the tissue from 0.26 to~8.5 mm. Reproduced with permission from Ref. .
Figure 17
Figure 17
An X-ray excited pH sensor, formed by measuring X-ray excited luminescence spectra through methyl red-dyed paper. (A) Schematic showing the pH sensor and (B) spectra of Gd2O2S:Tb through methyl red paper at different pH values. (C) Calibration curve: peak ratio as a function of pH. Error bars represent the standard deviation of five replicable trials. Reproduced with permission from Ref. .
Figure 18
Figure 18
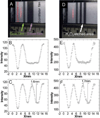
(A), (D) Images of a gold and silver coated scintillator film before and after H2O2 etching. (B), (E) Intensity of red light scanned at different positions with/without 10 mm of tissue before H2O2 etching. (C), (F) Intensity of red light scanned at different positions with/without 10 mm of tissue after H2O2 etching. The resolution through 10 mm tissue is 1.7 mm. Reproduced with permission from Ref. .
Figure 19
Figure 19
Light yield of scintillators and cathode ray tube phosphors. Reproduced with permission from Ref. .

Similar articles

Cited by

References

    1. Ono M. Chemical and Pharmaceutical Bulletin. 2009;57:1029–1039. - PubMed
    1. Rahmim A, Zaidi H. Nuclear medicine communications. 2008;29:193. - PubMed
    1. Levin CS, Hoffman EJ. Phys. Med. Bio. 1999;44:781. - PubMed
    1. Derenzo SE, Moses WW, Huesman RH, Budinger TF. Annals of nuclear medicine. 1993;7:3–3.
    1. Kojima A, Matsumoto M, Takahashi M, Hirota Y, Yoshida H. Journal of nuclear medicine: official publication, Society of Nuclear Medicine. 1989;30:508. - PubMed

Publication types