. 2012 Oct;63(16):5887-901.
doi: 10.1093/jxb/ers238. Epub 2012 Sep 7.

Mechanism of phytohormone involvement in feedback regulation of cotton leaf senescence induced by potassium deficiency

Affiliations

Mechanism of phytohormone involvement in feedback regulation of cotton leaf senescence induced by potassium deficiency

Ye Wang et al. J Exp Bot. 2012 Oct.

Abstract

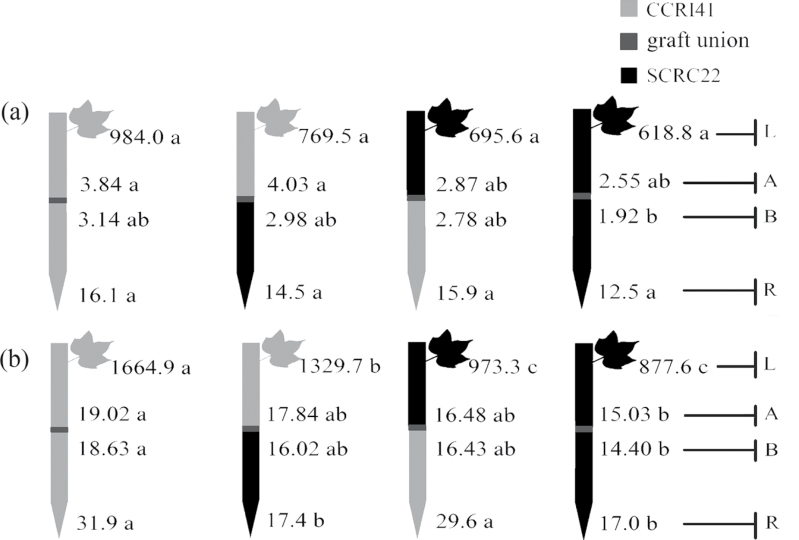
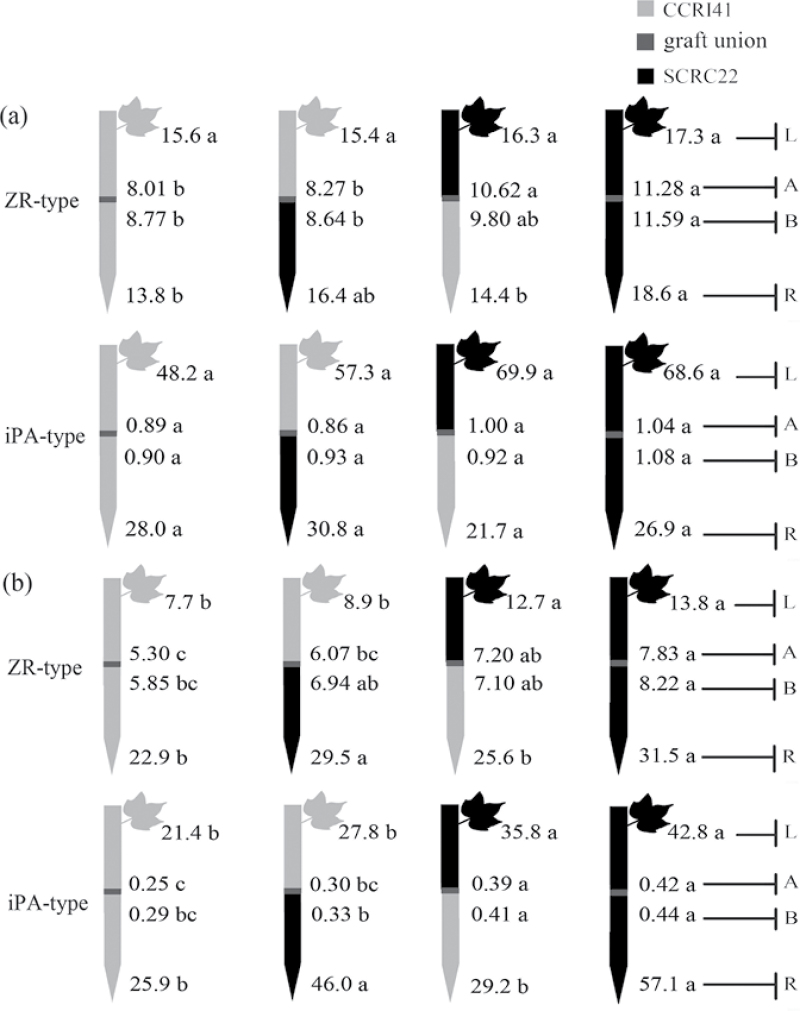
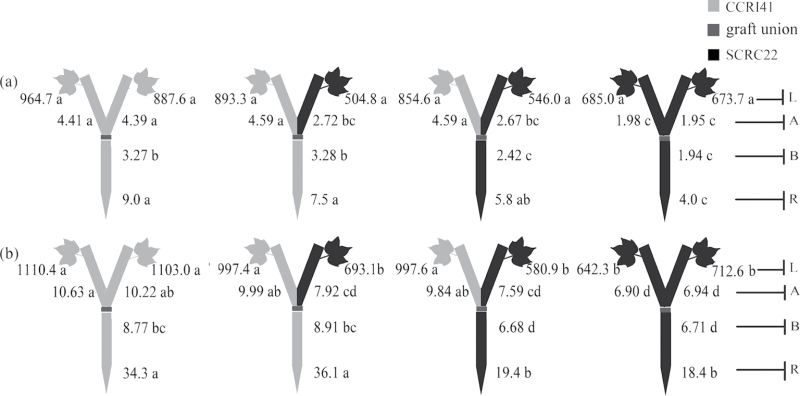
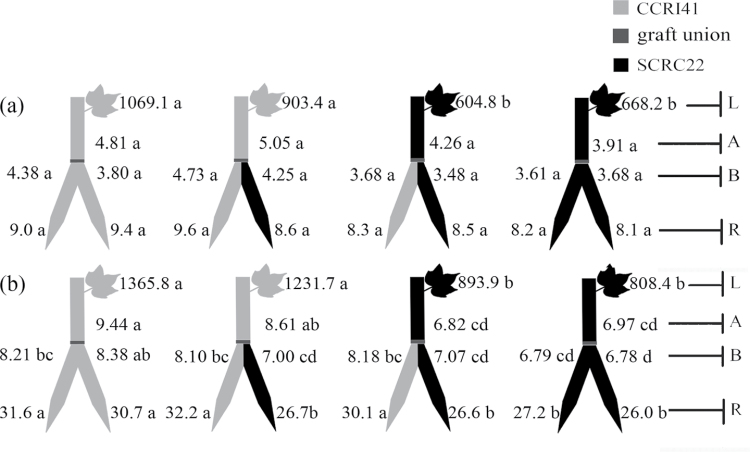
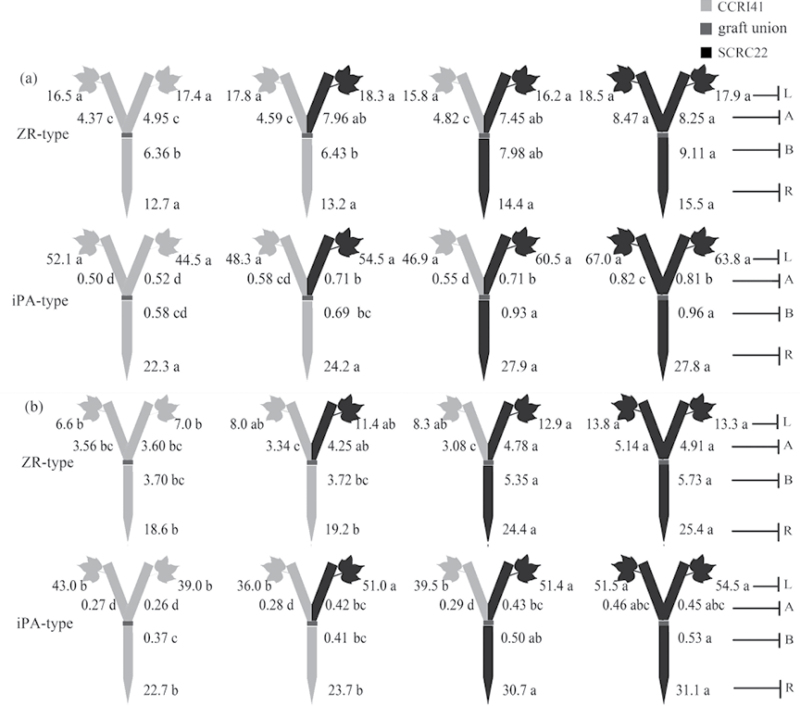
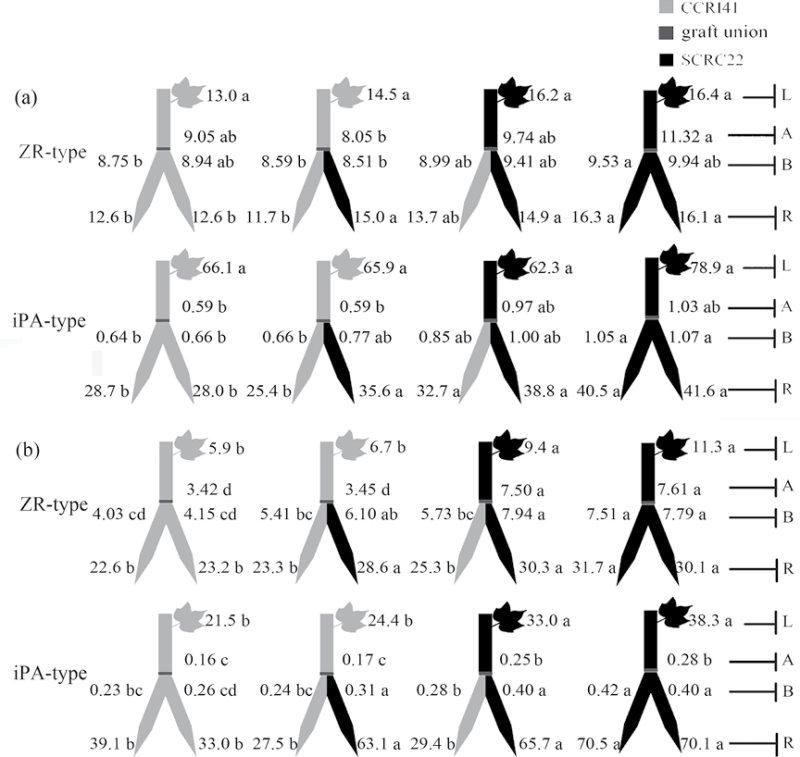
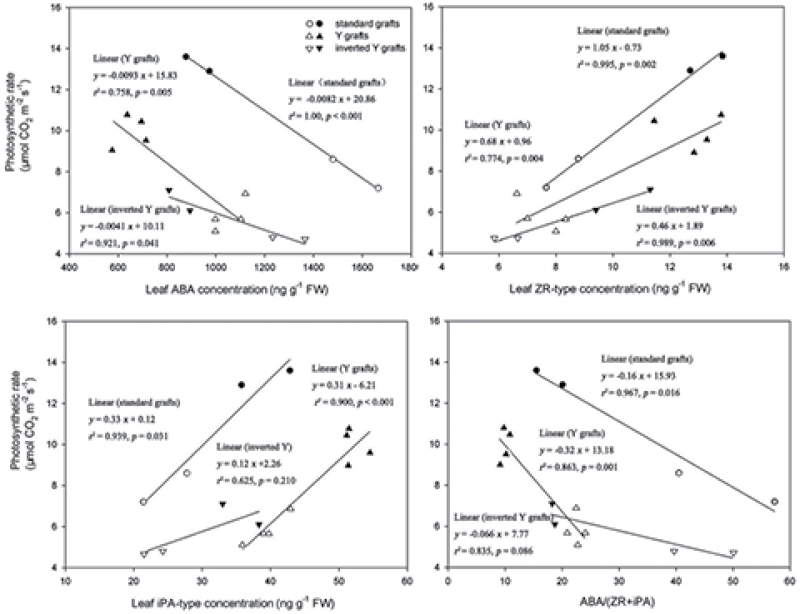
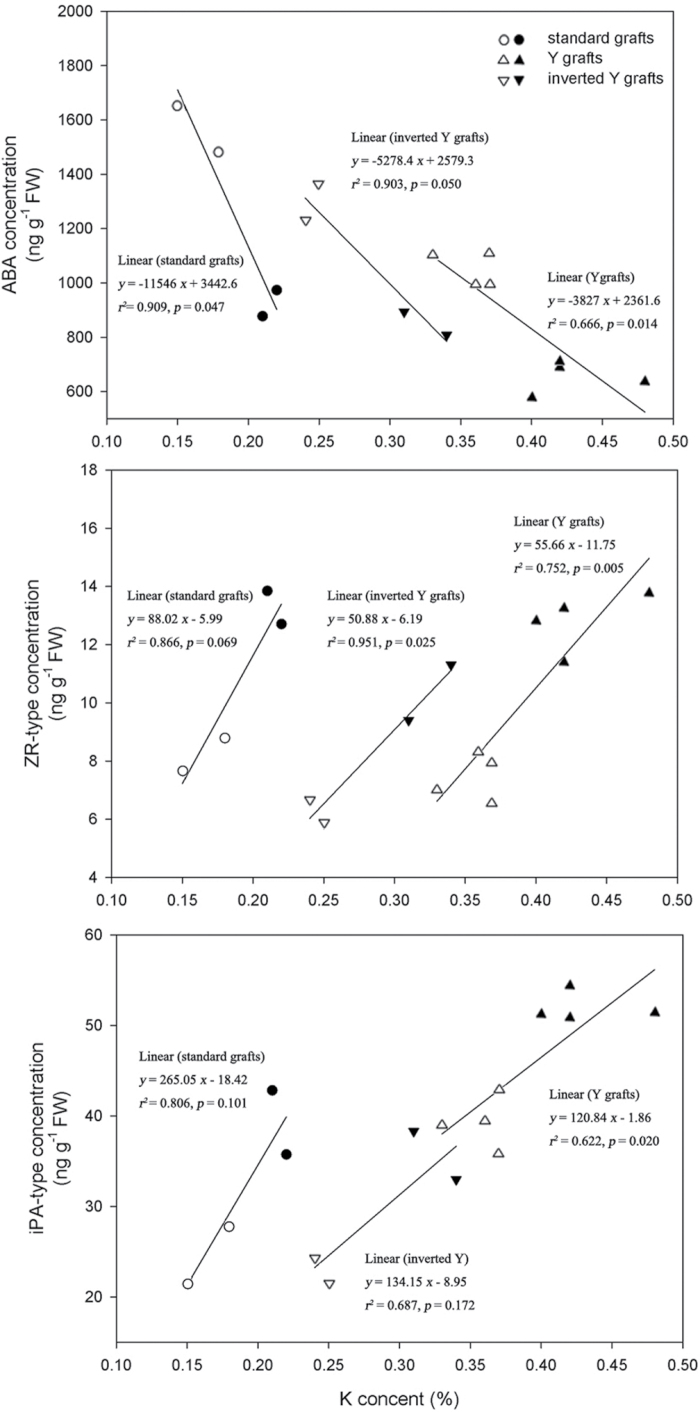
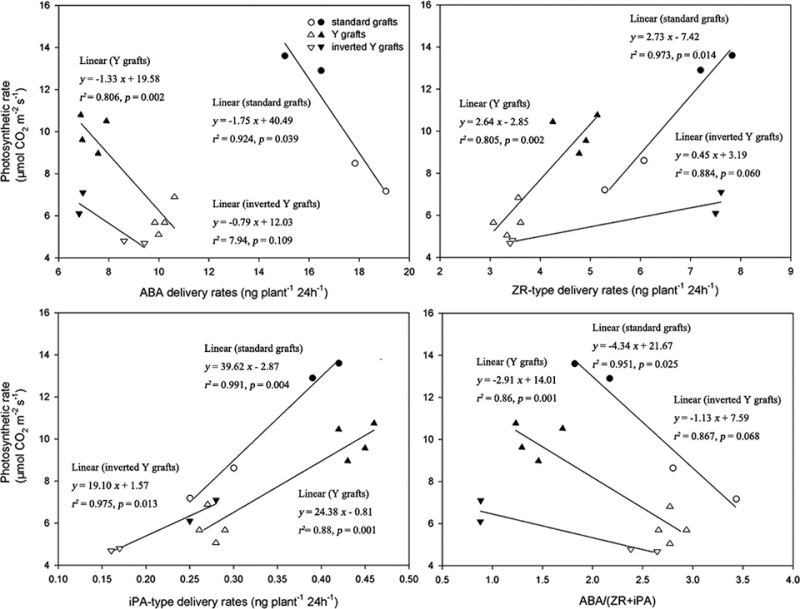
To elucidate the phytohormonal basis of the feedback regulation of leaf senescence induced by potassium (K) deficiency in cotton (Gossypium hirsutum L.), two cultivars contrasting in sensitivity to K deficiency were self- and reciprocally grafted hypocotyl-to-hypocotyl, using standard grafting (one scion grafted onto one rootstock), Y grafting (two scions grafted onto one rootstock), and inverted Y grafting (one scion grafted onto two rootstocks) at the seedling stage. K deficiency (0.03mM for standard and Y grafting, and 0.01mM for inverted Y grafting) increased the root abscisic acid (ABA) concentration by 1.6- to 3.1-fold and xylem ABA delivery rates by 1.8- to 4.6-fold. The K deficiency also decreased the delivery rates of xylem cytokinins [CKs; including the zeatin riboside (ZR) and isopentenyl adenosine (iPA) type] by 29-65% and leaf CK concentration by 16-57%. The leaf ABA concentration and xylem ABA deliveries were consistently greater in CCRI41 (more sensitive to K deficiency) than in SCRC22 (less sensitive to K deficiency) scions under K deficiency, and ZR- and iPA-type levels were consistently lower in the former than in the latter, irrespective of rootstock cultivar or grafting type, indicating that cotton shoot influences the levels of ABA and CKs in leaves and xylem sap. Because the scions had little influence on phytohormone levels in the roots (rootstocks) of all three types of grafts and rootstock xylem sap (collected below the graft union) of Y and inverted Y grafts, it appears that the site for basipetal feedback signal(s) involved in the regulation of xylem phytohormones is the hypocotyl of cotton seedlings. Also, the target of this feedback signal(s) is more likely to be the changes in xylem phytohormones within tissues of the hypocotyl rather than the export of phytohormones from the roots.


Figures

Fig. 1.
Fig. 1.
Effect of K deficiency on ABA levels of cotton standard graft (scion/rootstock) at the 8–9 leaf stage. Grafting was performed hypocotyl-to-hypocotyl at the 1-leaf stage of the rootstock and the cotyledonary stage of the scion. Grafts were maintained in nutrient solution with 0.1mM K during establishment, and transferred to solutions with either 2.5mM (a) or 0.03mM K (b) after establishment. The ABA concentrations (ng g–1 FW) in roots (R) and the youngest fully expanded leaf (L), and xylem ABA delivery rates (ng plant–1 24h–1) below (B) and above the graft union (A) were determined. For each K level, means of the same sampling part (i.e. roots, leaf, and xylem sap collected both below and above the graft union) followed by the same letter are not significantly different according to Duncan’s multiple range test, P < 0.05, n=4.
Fig. 2.
Fig. 2.
Effect of K deficiency on cytokinin (including the ZR-and iPA-type) levels of cotton standard graft (scion/rootstock) at the 8–9 leaf stage. Grafting was performed hypocotyl-to-hypocotyl at the 1-leaf stage of the rootstock and the cotyledonary stage of the scion. Grafts were maintained in nutrient solution with 0.1mM K during establishment, and transferred to solutions with either 2.5mM (a) or 0.03mM K (b) after establishment. The ZR- and iPA-type concentrations (ng g–1 FW) in roots (R) and the youngest fully expanded leaf (L), and xylem ZR- and iPA-type delivery rates (ng plant–1 24h–1) below (B) and above the graft union (A) were determined. For each K level, means of the same sampling part (i.e. roots, leaf, and xylem sap collected both below and above the graft union) followed by the same letter are not significantly different according to Duncan’s multiple range test, P < 0.05, n=4.
Fig. 3.
Fig. 3.
Effect of K deficiency on ABA levels of cotton Y graft (scion+scion/rootstock) at the 8–9 leaf stage. Grafting was performed hypocotyl-to-hypocotyl at the 1-leaf stage of the rootstock and the cotyledonary stage of the scion. Grafts were maintained in nutrient solution with 0.1mM K during establishment, and transferred to solutions with either 2.5mM (a) or 0.03mM K (b) after establishment. The ABA concentrations (ng g–1 FW) in roots (R) and the youngest fully expanded leaf (L), and xylem ABA delivery rates (ng plant–1 24h–1) below (B) and above the graft union (A) were determined. For each K level, means of the same sampling part (i.e. roots, leaf, and xylem sap collected both below and above the graft union) followed by the same letter are not significantly different according to Duncan’s multiple range test, P < 0.05, n=4.
Fig. 5.
Fig. 5.
Effect of K deficiency on ABA levels of cotton inverted Y graft (scion/rootstock+rootstock) cotton at the 8–9 leaf stage. Grafting was performed hypocotyl-to-hypocotyl at the 1-leaf stage of both the rootstock and scion. Grafts were maintained in nutrient solution with 0.1mM K during establishment, and transferred to solutions with either 2.5mM (a) or 0.01mM K (b) after establishment. The ABA concentrations (ng g–1 FW) in roots (R) and the youngest fully expanded leaf (L), and xylem ABA delivery rates (ng plant–1 24h–1) below (B) and above the graft union (A) were determined. For each K level, means of the same sampling part (i.e. roots, leaf, and xylem sap collected both below and above the graft union) followed by the same letter are not significantly different according to Duncan’s multiple range test, P < 0.05, n=4.
Fig. 4.
Fig. 4.
Effect of K deficiency on cytokinin (including the ZR-and iPA-type) levels of cotton Y graft (scion+scion/rootstock) at the 8–9 leaf stage. Grafting was performed hypocotyl-to-hypocotyl at the 1-leaf stage of the rootstock and the cotyledonary stage of the scion. Grafts were maintained in nutrient solution with 0.1mM K during establishment, and transferred to solutions with either 2.5mM (a) or 0.03mM K (b) after establishment. The ZR- and iPA-type concentrations (ng g–1 FW) in roots (R) and the youngest fully expanded leaf (L), and xylem ZR- and iPA-type delivery rates (ng plant–1 24h–1) below (B) and above the graft union (A) were determined. For each K level, means of the same sampling part (i.e. roots, leaf, and xylem sap collected both below and above the graft union) followed by the same letter are not significantly different according to Duncan’s multiple range test, P < 0.05, n=4.
Fig. 6.
Fig. 6.
Effect of K deficiency on cytokinin (including the ZR-and iPA-type) levels of cotton inverted Y graft (scion+scion/rootstock) cotton at the 8–9 leaf stage. Grafting was performed hypocotyl-to-hypocotyl at the 1-leaf stage of both the rootstock and scion. Grafts were maintained in nutrient solution with 0.1mM K during establishment, and transferred to solutions with either 2.5mM (a) or 0.01mM K (b) after establishment. The ZR- and iPA-type concentrations (ng g–1 FW) in roots (R) and the youngest fully expanded leaf (L), and xylem ZR- and iPA-type delivery rates (ng plant–1 24h–1) below (B) and above the graft union (A) were determined. For each K level, means of the same sampling part (i.e. roots, leaf, and xylem sap collected both below and above the graft union) followed by the same letter are not significantly different according to Duncan’s multiple range test, P < 0.05, n=4.
Fig. 7.
Fig. 7.
Relationships between leaf ABA, ZR-, and iPA-type concentrations, and ABA/(ZR+iPA) ratios (x) with photosynthetic rate (Pn) of the youngest fully expanded leaf (the fourth leaf from the top of the plant) grown under K deficiency (0.03mM for standard and Y grafts, and 0.01mM for inverted Y grafts). Open and filled circles denote CCR141 and SCRC22 scions of standard grafts, respectively; open and filled triangles denote CCR141 and SCRC22 scions of Y grafts; and open and filled inverted triangles denote CCR141 and SCRC22 scions of inverted Y grafts. Each point represents the mean of a grafting treatment averaged across three or four replicates, and each replicate consisted of 4–20 plants. The linear regressions were fitted with Sigmaplot 11.0.
Fig. 9.
Fig. 9.
Relationships between K content (x) and ABA, ZR-, and iPA-type concentrations in the youngest fully expanded leaf (the fourth leaf from the top of plant) grown under K deficiency (0.03mM for standard and Y grafts, and 0.01mM for inverted Y grafts). Open and filled circles denote CCR141 and SCRC22 scions of standard grafts, respectively; open and filled triangles denote CCR141 and SCRC22 scions of Y grafts; and open and filled inverted triangles denote CCR141 and SCRC22 scions of inverted Y grafts. Each point represents the mean of a grafting treatment averaged across three or four replicates, and each replicate consisted of 4–20 plants. The linear regressions were fitted with Sigmaplot 11.0.
Fig. 8.
Fig. 8.
Relationships between ABA, ZR-, and iPA-type delivery rates, and ABA/(ZR+iPA) ratios (x) in scion xylem sap (collected above the graft union) and photosynthetic rate (Pn) of the youngest fully expanded leaf (the fourth leaf from the top of the plant) grown under K deficiency (0.03mM for standard and Y grafts, and 0.01mM for inverted Y grafts). Open and filled circles denote CCR141 and SCRC22 scions of standard grafts, respectively; open and filled triangles denote CCR141 and SCRC22 scions of Y grafts; and open and filled inverted triangles denote CCR141 and SCRC22 scions of inverted Y grafts. Each point represents the mean of a grafting treatment averaged across three or four replicates, and each replicate consisted of 4–20 plants. The linear regressions were fitted with Sigmaplot 11.0.

Similar articles

Cited by

References

    1. Albacete A, Ghanem ME, Dodd IC, Pérez-Alfocea F. 2010. Principal component analysis of hormone profiling data suggests an important role for cytokinins in regulating leaf growth and senescence of salinized tomato Plant Signaling and Behavior 5 45–48 - PMC - PubMed
    1. Albacete A, Martinez-Andujar C, Ghanem ME, Acosta M, Sanchez-Bravo J, Asins MJ, Cuartero J, Lutts S, Dodd IC, Pérez-Alfocea F. 2009. Rootstock-mediated changes in xylem ionic and hormonal status are correlated with delayed leaf senescence, and increased leaf area and crop productivity in salinized tomato Plant, Cell and Environment 32 928–938 - PubMed
    1. Bednarz CW, Oosterhuis DM. 1995. Plant potassium partitioning during progression of deficiency symptoms in cotton (Gossypium hirsutum). Better Crops Potash and Phosphate Institute 79 12–14
    1. Beveridge CA, Murfet IC, Kerhoas L, Sotta B, Miginiac E, Rameau C. 1997. The shoot controls zeatin riboside export from pea roots. Evidence from the branching mutant rms4 The Plant Journal 11 339–345
    1. Buchanan-Wollaston V, Page T, Harrison E, Breeze E, Lim PO, Nam HG, Lin JF, Wu SH, Swidzinski J, Ishizaki K, Leaver CJ. 2005. Comparative transcriptome analysis reveals significant differences in gene expression and signalling pathways between developmental and dark/starvation-induced senescence in Arabidopsis The Plant Journal 42 567–585 - PubMed

Publication types

MeSH terms