

Cooperative interaction of MUC1 with the HGF/c-Met pathway during hepatocarcinogenesis
- PMID: 22962849
- PMCID: PMC3542123
- DOI: 10.1186/1476-4598-11-64
Cooperative interaction of MUC1 with the HGF/c-Met pathway during hepatocarcinogenesis
Abstract
Background: Hepatocyte growth factor (HGF) induced c-Met activation is known as the main stimulus for hepatocyte proliferation and is essential for liver development and regeneration. Activation of HGF/c-Met signaling has been correlated with aggressive phenotype and poor prognosis in hepatocellular carcinoma (HCC). MUC1 is a transmembrane mucin, whose over-expression is reported in most cancers. Many of the oncogenic effects of MUC1 are believed to occur through the interaction of MUC1 with signaling molecules. To clarify the role of MUC1 in HGF/c-Met signaling, we determined whether MUC1 and c-Met interact cooperatively and what their role(s) is in hepatocarcinogenesis.
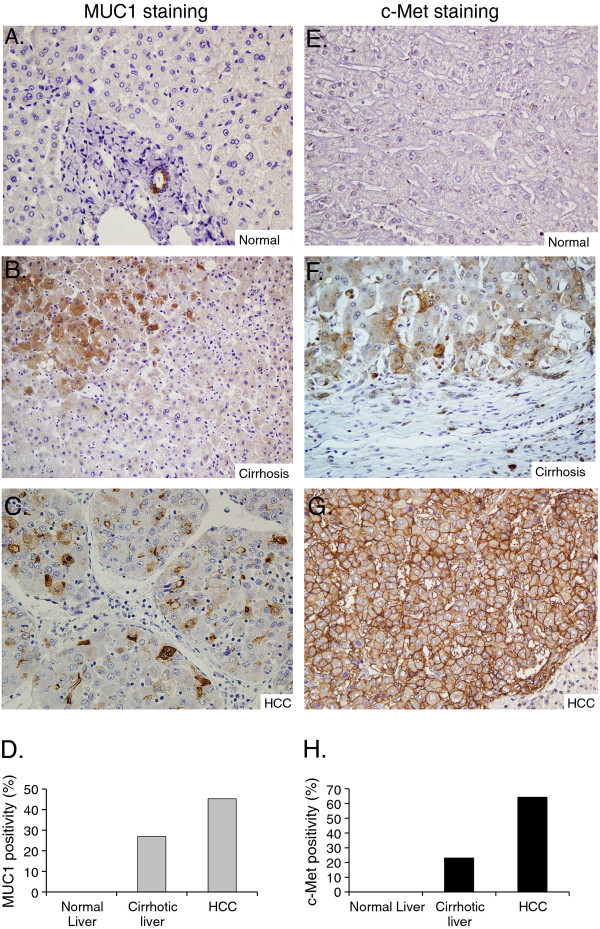
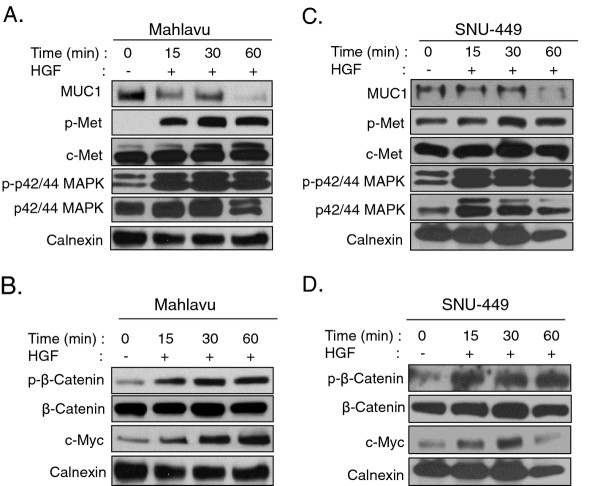
Results: MUC1 and c-Met over-expression levels were determined in highly motile and invasive, mesenchymal-like HCC cell lines, and in serial sections of cirrhotic and HCC tissues, and these levels were compared to those in normal liver tissues. Co-expression of both c-Met and MUC1 was found to be associated with the differentiation status of HCC. We further demonstrated an interaction between c-Met and MUC1 in HCC cells. HGF-induced c-Met phosphorylation decreased this interaction, and down-regulated MUC1 expression. Inhibition of c-Met activation restored HGF-mediated MUC1 down-regulation, and decreased the migratory and invasive abilities of HCC cells via inhibition of β-catenin activation and c-Myc expression. In contrast, siRNA silencing of MUC1 increased HGF-induced c-Met activation and HGF-induced cell motility and invasion.
Conclusions: These findings indicate that the crosstalk between MUC1 and c-Met in HCC could provide an advantage for invasion to HCC cells through the β-catenin/c-Myc pathway. Thus, MUC1 and c-Met could serve as potential therapeutic targets in HCC.
Figures


Similar articles
-
Reciprocal activating crosstalk between c-Met and caveolin 1 promotes invasive phenotype in hepatocellular carcinoma.PLoS One. 2014 Aug 22;9(8):e105278. doi: 10.1371/journal.pone.0105278. eCollection 2014. PLoS One. 2014. PMID: 25148256 Free PMC article.
-
Updates on the hepatocyte growth factor/c-Met axis in hepatocellular carcinoma and its therapeutic implications.World J Gastroenterol. 2018 Sep 7;24(33):3695-3708. doi: 10.3748/wjg.v24.i33.3695. World J Gastroenterol. 2018. PMID: 30197476 Free PMC article. Review.
-
Heparin inhibits Hepatocyte Growth Factor induced motility and invasion of hepatocellular carcinoma cells through early growth response protein 1.PLoS One. 2012;7(8):e42717. doi: 10.1371/journal.pone.0042717. Epub 2012 Aug 13. PLoS One. 2012. PMID: 22912725 Free PMC article.
-
Elevated hepatocyte growth factor expression as an autocrine c-Met activation mechanism in acquired resistance to sorafenib in hepatocellular carcinoma cells.Cancer Sci. 2016 Apr;107(4):407-16. doi: 10.1111/cas.12891. Epub 2016 Feb 23. Cancer Sci. 2016. PMID: 26790028 Free PMC article.
-
Association between the HGF/c‑MET signaling pathway and tumorigenesis, progression and prognosis of hepatocellular carcinoma (Review).Oncol Rep. 2021 Sep;46(3):191. doi: 10.3892/or.2021.8142. Epub 2021 Jul 19. Oncol Rep. 2021. PMID: 34278495 Review.
Cited by
-
Decreased expression of hepatocyte nuclear factor 4α (Hnf4α)/microRNA-122 (miR-122) axis in hepatitis B virus-associated hepatocellular carcinoma enhances potential oncogenic GALNT10 protein activity.J Biol Chem. 2015 Jan 9;290(2):1170-85. doi: 10.1074/jbc.M114.601203. Epub 2014 Nov 24. J Biol Chem. 2015. PMID: 25422324 Free PMC article.
-
Reciprocal activating crosstalk between c-Met and caveolin 1 promotes invasive phenotype in hepatocellular carcinoma.PLoS One. 2014 Aug 22;9(8):e105278. doi: 10.1371/journal.pone.0105278. eCollection 2014. PLoS One. 2014. PMID: 25148256 Free PMC article.
-
Targeting Wnt/β-Catenin Pathways in Primary Liver Tumours: From Microenvironment Signaling to Therapeutic Agents.Cancers (Basel). 2022 Apr 10;14(8):1912. doi: 10.3390/cancers14081912. Cancers (Basel). 2022. PMID: 35454818 Free PMC article. Review.
-
Updates on the hepatocyte growth factor/c-Met axis in hepatocellular carcinoma and its therapeutic implications.World J Gastroenterol. 2018 Sep 7;24(33):3695-3708. doi: 10.3748/wjg.v24.i33.3695. World J Gastroenterol. 2018. PMID: 30197476 Free PMC article. Review.
-
MUC1 is responsible for the pro-metastatic potential of calycosin in pancreatic ductal adenocarcinoma.Am J Cancer Res. 2022 Jul 15;12(7):3242-3258. eCollection 2022. Am J Cancer Res. 2022. PMID: 35968328 Free PMC article.
References
-
- Wong CM, Ng IO. Molecular pathogenesis of hepatocellular carcinoma. Liver Int. 2008;28:160–174. - PubMed
Publication types
MeSH terms
Substances
Grants and funding
LinkOut - more resources
Full Text Sources
Medical
Molecular Biology Databases
Research Materials
Miscellaneous
