

Bayesian model selection techniques as decision support for shaping a statistical analysis plan of a clinical trial: an example from a vertigo phase III study with longitudinal count data as primary endpoint
- PMID: 22962944
- PMCID: PMC3554595
- DOI: 10.1186/1471-2288-12-137
Bayesian model selection techniques as decision support for shaping a statistical analysis plan of a clinical trial: an example from a vertigo phase III study with longitudinal count data as primary endpoint
Abstract
Background: A statistical analysis plan (SAP) is a critical link between how a clinical trial is conducted and the clinical study report. To secure objective study results, regulatory bodies expect that the SAP will meet requirements in pre-specifying inferential analyses and other important statistical techniques. To write a good SAP for model-based sensitivity and ancillary analyses involves non-trivial decisions on and justification of many aspects of the chosen setting. In particular, trials with longitudinal count data as primary endpoints pose challenges for model choice and model validation. In the random effects setting, frequentist strategies for model assessment and model diagnosis are complex and not easily implemented and have several limitations. Therefore, it is of interest to explore Bayesian alternatives which provide the needed decision support to finalize a SAP.
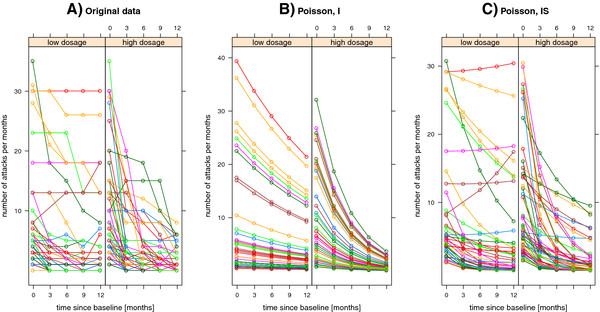
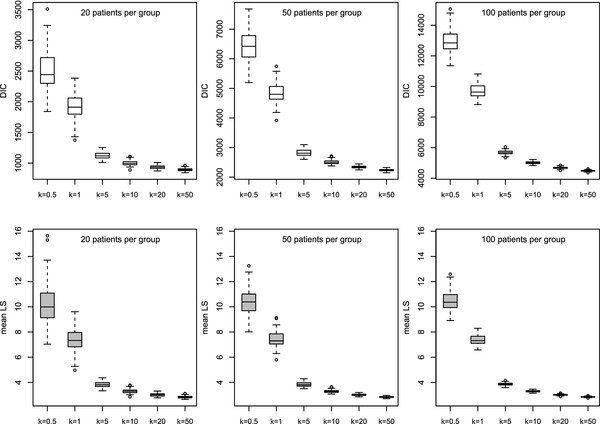
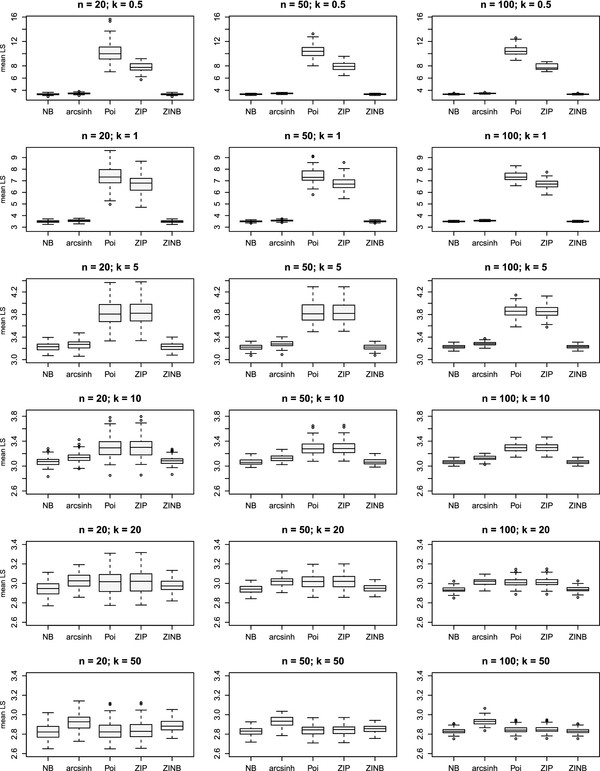
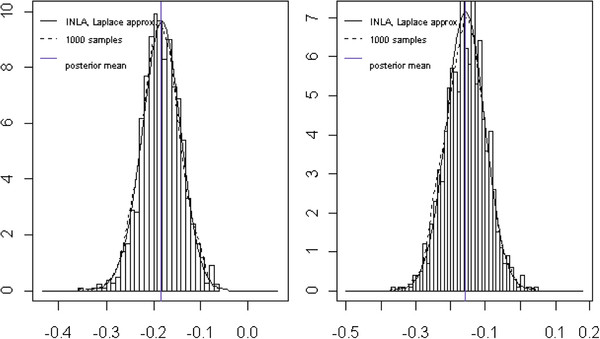
Methods: We focus on generalized linear mixed models (GLMMs) for the analysis of longitudinal count data. A series of distributions with over- and under-dispersion is considered. Additionally, the structure of the variance components is modified. We perform a simulation study to investigate the discriminatory power of Bayesian tools for model criticism in different scenarios derived from the model setting. We apply the findings to the data from an open clinical trial on vertigo attacks. These data are seen as pilot data for an ongoing phase III trial. To fit GLMMs we use a novel Bayesian computational approach based on integrated nested Laplace approximations (INLAs). The INLA methodology enables the direct computation of leave-one-out predictive distributions. These distributions are crucial for Bayesian model assessment. We evaluate competing GLMMs for longitudinal count data according to the deviance information criterion (DIC) or probability integral transform (PIT), and by using proper scoring rules (e.g. the logarithmic score).
Results: The instruments under study provide excellent tools for preparing decisions within the SAP in a transparent way when structuring the primary analysis, sensitivity or ancillary analyses, and specific analyses for secondary endpoints. The mean logarithmic score and DIC discriminate well between different model scenarios. It becomes obvious that the naive choice of a conventional random effects Poisson model is often inappropriate for real-life count data. The findings are used to specify an appropriate mixed model employed in the sensitivity analyses of an ongoing phase III trial.
Conclusions: The proposed Bayesian methods are not only appealing for inference but notably provide a sophisticated insight into different aspects of model performance, such as forecast verification or calibration checks, and can be applied within the model selection process. The mean of the logarithmic score is a robust tool for model ranking and is not sensitive to sample size. Therefore, these Bayesian model selection techniques offer helpful decision support for shaping sensitivity and ancillary analyses in a statistical analysis plan of a clinical trial with longitudinal count data as the primary endpoint.
Figures

References
Publication types
MeSH terms
Substances
LinkOut - more resources
Full Text Sources
Medical
Miscellaneous
