

Differential effects of arsenic trioxide on chemosensitization in human hepatic tumor and stellate cell lines
- PMID: 22963400
- PMCID: PMC3517386
- DOI: 10.1186/1471-2407-12-402
Differential effects of arsenic trioxide on chemosensitization in human hepatic tumor and stellate cell lines
Abstract
Background: Crosstalk between malignant hepatocytes and the surrounding peritumoral stroma is a key modulator of hepatocarcinogenesis and therapeutic resistance. To examine the chemotherapy resistance of these two cellular compartments in vitro, we evaluated a well-established hepatic tumor cell line, HepG2, and an adult hepatic stellate cell line, LX2. The aim was to compare the chemosensitization potential of arsenic trioxide (ATO) in combination with sorafenib or fluorouracil (5-FU), in both hepatic tumor cells and stromal cells.
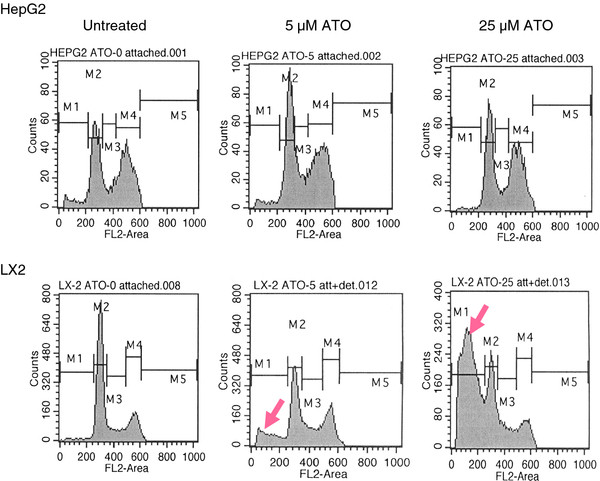
Methods: Cytotoxicity of ATO, 5-FU, and sorafenib, alone and in combination against HepG2 cells and LX2 cells was measured by an automated high throughput cell-based proliferation assay. Changes in survival and apoptotic signaling pathways were analyzed by flow cytometry and western blot. Gene expression of the 5-FU metabolic enzyme, thymidylate synthase, was analyzed by real time PCR.
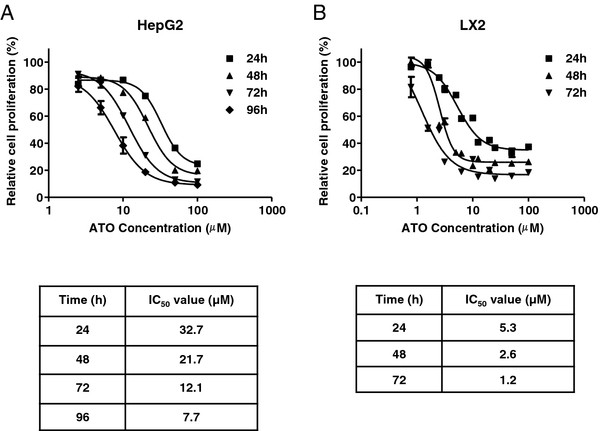
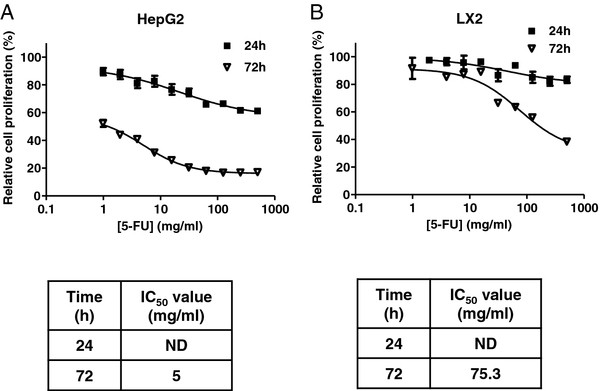
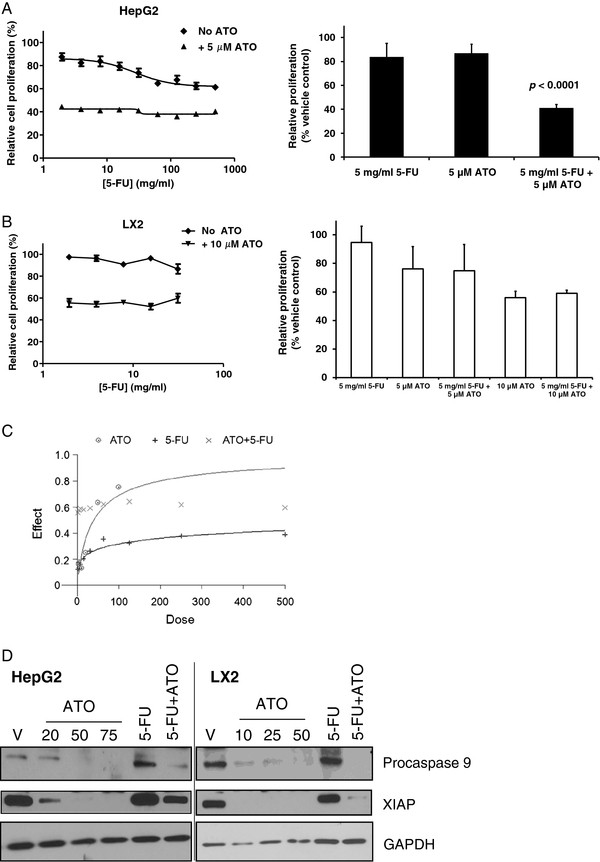
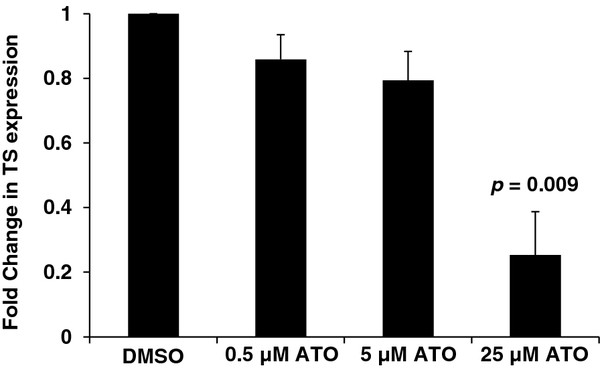
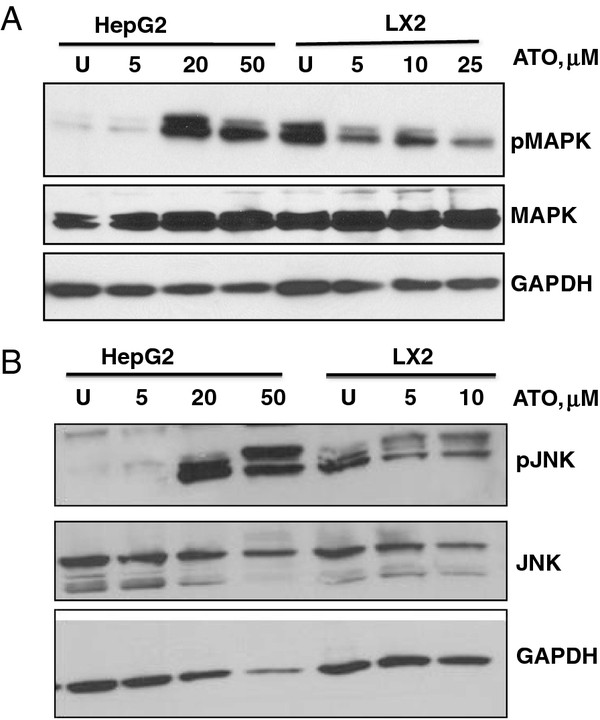
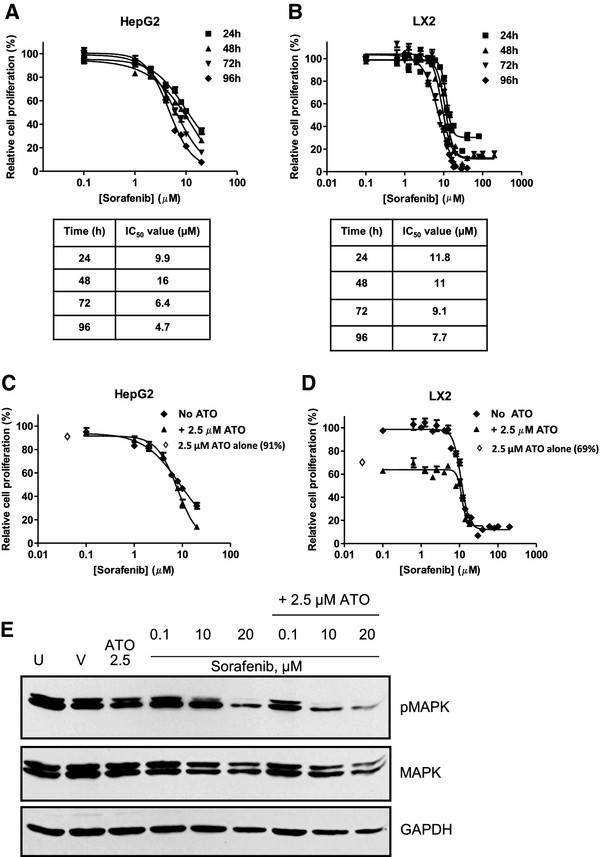
Results: Both HepG2 and LX2 cell lines were susceptible to single agent sorafenib and ATO at 24 hr (ATO IC(50): 5.3 μM in LX2; 32.7 μM in HepG2; Sorafenib IC(50): 11.8 μM in LX2; 9.9 μM in HepG2). In contrast, 5-FU cytotoxicity required higher concentrations and prolonged (48-72 hr) drug exposure. Concurrent ATO and 5-FU treatment of HepG2 cells was synergistic, leading to increased cytotoxicity due in part to modulation of thymidylate synthase levels by ATO. Concurrent ATO and sorafenib treatment showed a trend towards increased HepG2 cytotoxicity, possibly due to a significant decrease in MAPK activation in comparison to treatment with ATO alone.
Conclusions: ATO differentially sensitizes hepatic tumor cells and adult hepatic stellate cells to 5-FU and sorafenib. Given the importance of both of these cell types in hepatocarcinogenesis, these data have implications for the rational development of anti-cancer therapy combinations for the treatment of hepatocellular carcinoma (HCC).
Figures
Similar articles
-
Arsenic trioxide potentiates the anti-cancer activities of sorafenib against hepatocellular carcinoma by inhibiting Akt activation.Tumour Biol. 2015 Apr;36(4):2323-34. doi: 10.1007/s13277-014-2839-3. Epub 2014 Nov 22. Tumour Biol. 2015. PMID: 25416439
-
Sorafenib inhibition of hepatic stellate cell proliferation in tumor microenvironment of hepatocellular carcinoma: a study of the sorafenib mechanisms.Cell Biochem Biophys. 2014 Jul;69(3):717-24. doi: 10.1007/s12013-014-9858-y. Cell Biochem Biophys. 2014. PMID: 24633454
-
Fasting inhibits hepatic stellate cells activation and potentiates anti-cancer activity of Sorafenib in hepatocellular cancer cells.J Cell Physiol. 2018 Feb;233(2):1202-1212. doi: 10.1002/jcp.25987. Epub 2017 Jul 11. J Cell Physiol. 2018. PMID: 28471474
-
Nanocarrier-based delivery of arsenic trioxide for hepatocellular carcinoma therapy.Nanomedicine (Lond). 2022 Nov;17(26):2037-2054. doi: 10.2217/nnm-2022-0250. Epub 2023 Feb 15. Nanomedicine (Lond). 2022. PMID: 36789952 Review.
-
The Curious Case of the HepG2 Cell Line: 40 Years of Expertise.Int J Mol Sci. 2021 Dec 4;22(23):13135. doi: 10.3390/ijms222313135. Int J Mol Sci. 2021. PMID: 34884942 Free PMC article. Review.
Cited by
-
Tumor-treating fields in combination with sorafenib restrain the proliferation of liver cancer in vitro.Oncol Lett. 2022 Aug 11;24(4):338. doi: 10.3892/ol.2022.13458. eCollection 2022 Oct. Oncol Lett. 2022. PMID: 36039063 Free PMC article.
-
Hepatocellular Carcinoma: Etiology and Current and Future Drugs.J Clin Exp Hepatol. 2019 Mar-Apr;9(2):221-232. doi: 10.1016/j.jceh.2019.01.004. Epub 2019 Jan 25. J Clin Exp Hepatol. 2019. PMID: 31024205 Free PMC article. Review.
-
In the war against solid tumors arsenic trioxide needs partners.J Gastrointest Cancer. 2014 Sep;45(3):363-71. doi: 10.1007/s12029-014-9617-8. J Gastrointest Cancer. 2014. PMID: 24825822 Review.
-
Quantitative high-throughput efficacy profiling of approved oncology drugs in inflammatory breast cancer models of acquired drug resistance and re-sensitization.Cancer Lett. 2013 Aug 28;337(1):77-89. doi: 10.1016/j.canlet.2013.05.017. Epub 2013 May 17. Cancer Lett. 2013. PMID: 23689139 Free PMC article.
-
Arsenic trioxide potentiates the anti-cancer activities of sorafenib against hepatocellular carcinoma by inhibiting Akt activation.Tumour Biol. 2015 Apr;36(4):2323-34. doi: 10.1007/s13277-014-2839-3. Epub 2014 Nov 22. Tumour Biol. 2015. PMID: 25416439
References
-
- Sancho-Bru P, Juez E, Moreno M, Khurdayan V, Morales-Ruiz M, Colmenero J, Arroyo V, Brenner DA, Gines P, Bataller R. Hepatocarcinoma cells stimulate the growth, migration and expression of pro-angiogenic genes in human hepatic stellate cells. Liver Int. 2010;30:31–41. doi: 10.1111/j.1478-3231.2009.02161.x. - DOI - PubMed
Publication types
MeSH terms
Substances
LinkOut - more resources
Full Text Sources
