

Regulation of neuraminidase expression in Streptococcus pneumoniae
- PMID: 22963456
- PMCID: PMC3509027
- DOI: 10.1186/1471-2180-12-200
Regulation of neuraminidase expression in Streptococcus pneumoniae
Abstract
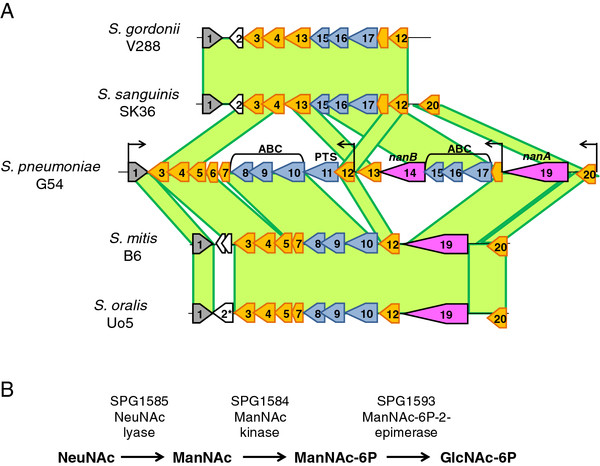
Background: Sialic acid (N-acetylneuraminic acid; NeuNAc) is one of the most important carbohydrates for Streptococcus pneumoniae due of its role as a carbon and energy source, receptor for adhesion and invasion and molecular signal for promotion of biofilm formation, nasopharyngeal carriage and invasion of the lung.
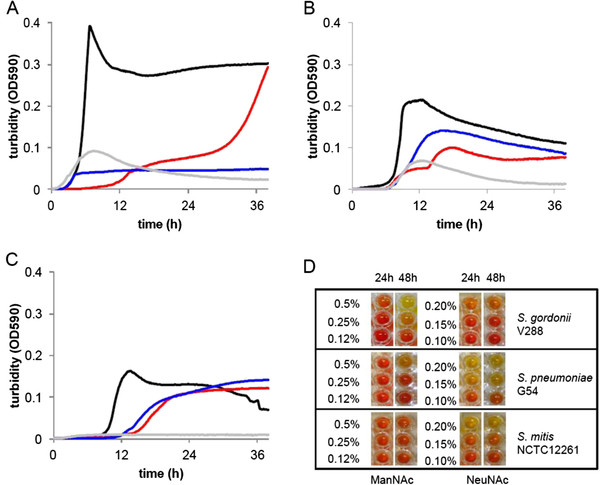
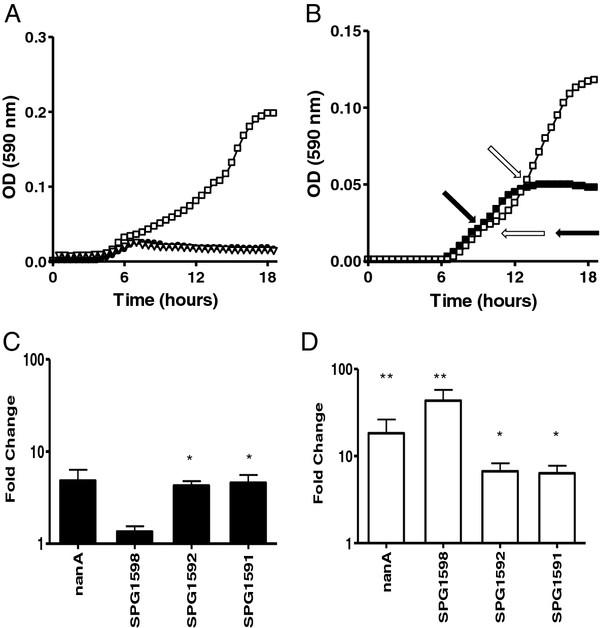
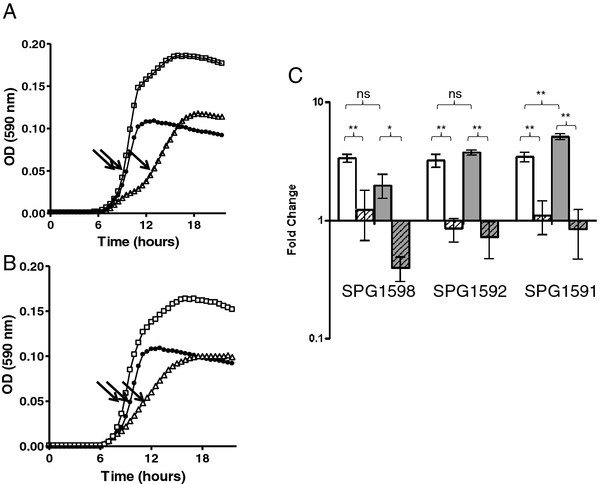
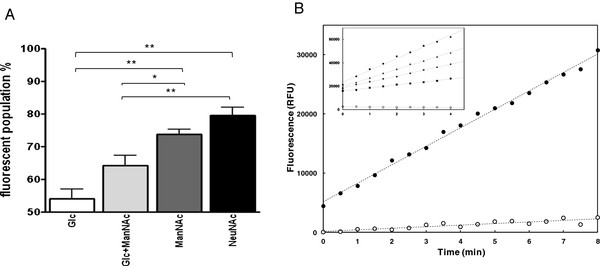
Results: In this work, NeuNAc and its metabolic derivative N-acetyl mannosamine (ManNAc) were used to analyze regulatory mechanisms of the neuraminidase locus expression. Genomic and metabolic comparison to Streptococcus mitis, Streptococcus oralis, Streptococcus gordonii and Streptococcus sanguinis elucidates the metabolic association of the two amino sugars to different parts of the locus coding for the two main pneumococcal neuraminidases and confirms the substrate specificity of the respective ABC transporters. Quantitative gene expression analysis shows repression of the locus by glucose and induction of all predicted transcriptional units by ManNAc and NeuNAc, each inducing with higher efficiency the operon encoding for the transporter with higher specificity for the respective amino sugar. Cytofluorimetric analysis demonstrated enhanced surface exposure of NanA on pneumococci grown in NeuNAc and ManNAc and an activity assay allowed to quantify approximately twelve times as much neuraminidase activity on induced cells as opposed to glucose grown cells.
Conclusions: The present data increase the understanding of metabolic regulation of the nanAB locus and indicate that experiments aimed at the elucidation of the relevance of neuraminidases in pneumococcal virulence should possibly not be carried out on bacteria grown in glucose containing media.
Figures
Similar articles
-
Neuraminidase A-Exposed Galactose Promotes Streptococcus pneumoniae Biofilm Formation during Colonization.Infect Immun. 2016 Sep 19;84(10):2922-32. doi: 10.1128/IAI.00277-16. Print 2016 Oct. Infect Immun. 2016. PMID: 27481242 Free PMC article.
-
Sialic acid: a preventable signal for pneumococcal biofilm formation, colonization, and invasion of the host.J Infect Dis. 2009 May 15;199(10):1497-505. doi: 10.1086/598483. J Infect Dis. 2009. PMID: 19392624
-
Sialic acid-mediated gene expression in Streptococcus pneumoniae and role of NanR as a transcriptional activator of the nan gene cluster.Appl Environ Microbiol. 2015 May 1;81(9):3121-31. doi: 10.1128/AEM.00499-15. Epub 2015 Feb 27. Appl Environ Microbiol. 2015. PMID: 25724955 Free PMC article.
-
Streptococcus pneumoniae two-component regulatory systems: The interplay of the pneumococcus with its environment.Int J Med Microbiol. 2018 Aug;308(6):722-737. doi: 10.1016/j.ijmm.2017.11.012. Epub 2017 Nov 26. Int J Med Microbiol. 2018. PMID: 29221986 Review.
-
Pneumococcal carbohydrate transport: food for thought.Trends Microbiol. 2012 Nov;20(11):517-22. doi: 10.1016/j.tim.2012.08.008. Epub 2012 Sep 5. Trends Microbiol. 2012. PMID: 22959614 Free PMC article. Review.
Cited by
-
Virulence Traits of a Serogroup C Meningococcus and Isogenic cssA Mutant, Defective in Surface-Exposed Sialic Acid, in a Murine Model of Meningitis.Infect Immun. 2019 Mar 25;87(4):e00688-18. doi: 10.1128/IAI.00688-18. Print 2019 Apr. Infect Immun. 2019. PMID: 30718288 Free PMC article.
-
Desialylation of Platelets by Pneumococcal Neuraminidase A Induces ADP-Dependent Platelet Hyperreactivity.Infect Immun. 2018 Sep 21;86(10):e00213-18. doi: 10.1128/IAI.00213-18. Print 2018 Oct. Infect Immun. 2018. PMID: 30037798 Free PMC article.
-
Structural and enzymatic characterization of the sialidase SiaPG from Porphyromonas gingivalis.Acta Crystallogr F Struct Biol Commun. 2023 Apr 1;79(Pt 4):87-94. doi: 10.1107/S2053230X23001735. Epub 2023 Mar 30. Acta Crystallogr F Struct Biol Commun. 2023. PMID: 36995120 Free PMC article.
-
Pyruvate oxidase influences the sugar utilization pattern and capsule production in Streptococcus pneumoniae.PLoS One. 2013 Jul 3;8(7):e68277. doi: 10.1371/journal.pone.0068277. Print 2013. PLoS One. 2013. PMID: 23844180 Free PMC article.
-
Streptococcus pneumoniae Senses a Human-like Sialic Acid Profile via the Response Regulator CiaR.Cell Host Microbe. 2016 Sep 14;20(3):307-317. doi: 10.1016/j.chom.2016.07.019. Epub 2016 Sep 1. Cell Host Microbe. 2016. PMID: 27593514 Free PMC article.
References
Publication types
MeSH terms
Substances
LinkOut - more resources
Full Text Sources
Other Literature Sources
