Comparative Study
. 2012 Sep 10;14(1):63.
doi: 10.1186/1532-429X-14-63.

Extracellular volume fraction mapping in the myocardium, part 1: evaluation of an automated method

Affiliations
Comparative Study

Extracellular volume fraction mapping in the myocardium, part 1: evaluation of an automated method

Peter Kellman et al. J Cardiovasc Magn Reson. .

Abstract

Background: Disturbances in the myocardial extracellular volume fraction (ECV), such as diffuse or focal myocardial fibrosis or edema, are hallmarks of heart disease. Diffuse ECV changes are difficult to assess or quantify with cardiovascular magnetic resonance (CMR) using conventional late gadolinium enhancement (LGE), or pre- or post-contrast T1-mapping alone. ECV measurement circumvents factors that confound T1-weighted images or T1-maps, and has been shown to correlate well with diffuse myocardial fibrosis. The goal of this study was to develop and evaluate an automated method for producing a pixel-wise map of ECV that would be adequately robust for clinical work flow.

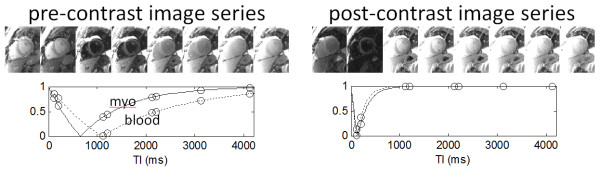
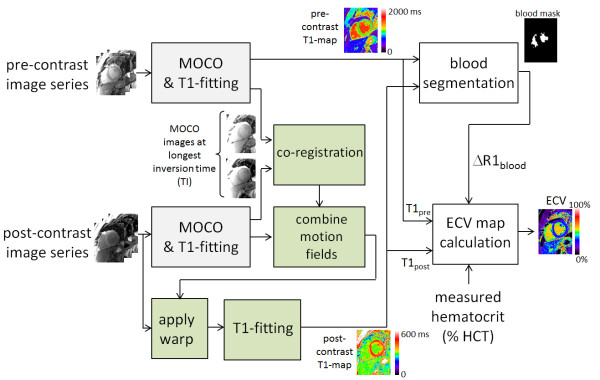
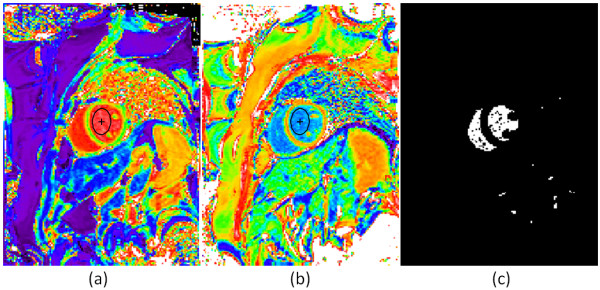
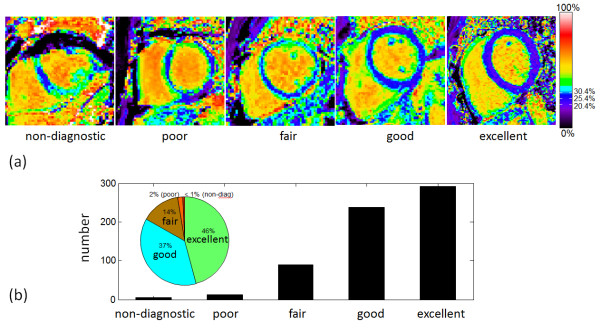
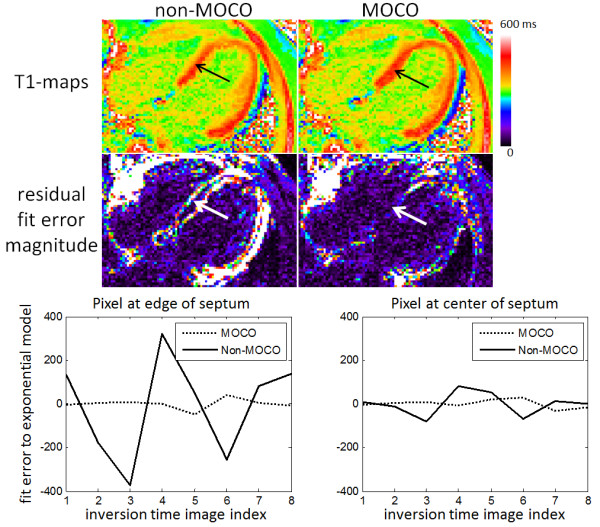
Methods: ECV maps were automatically generated from T1-maps acquired pre- and post-contrast calibrated by blood hematocrit. The algorithm incorporates correction of respiratory motion that occurs due to insufficient breath-holding and due to misregistration between breath-holds, as well as automated identification of the blood pool. Images were visually scored on a 5-point scale from non-diagnostic (1) to excellent (5).

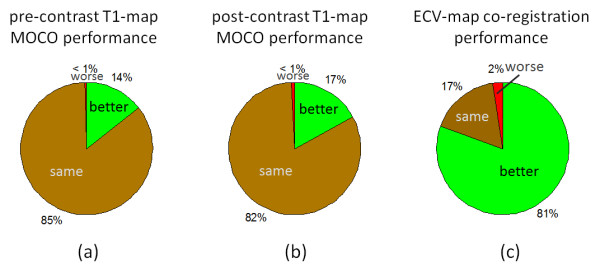
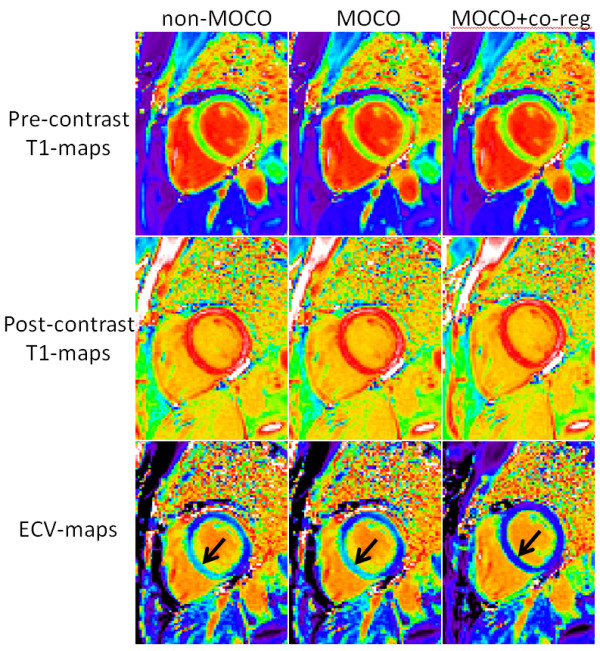
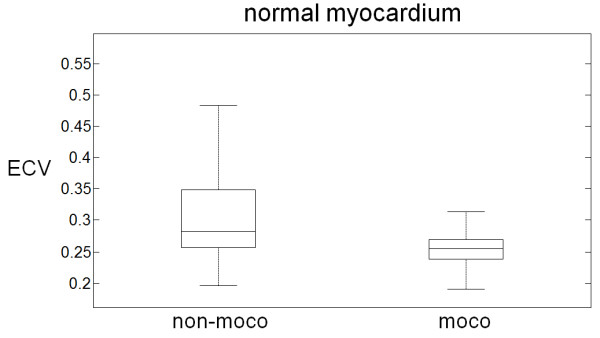
Results: The quality score of ECV maps was 4.23 ± 0.83 (m ± SD), scored for n=600 maps from 338 patients with 83% either excellent or good. Co-registration of the pre-and post-contrast images improved the image quality for ECV maps in 81% of the cases. ECV of normal myocardium was 25.4 ± 2.5% (m ± SD) using motion correction and co-registration values and was 31.5 ± 8.7% without motion correction and co-registration.

Conclusions: Fully automated motion correction and co-registration of breath-holds significantly improve the quality of ECV maps, thus making the generation of ECV-maps feasible for clinical work flow.


Figures

Figure 1
Figure 1
Pre- and post-contrast image series acquired using a Modified Look Locker Inversion Recovery (MOLLI) sequence used for T1-mapping.
Figure 2
Figure 2
Schematic flow chart for automatic generation of ECV maps by respiratory motion correction of pre- and post-contrast inversion recovery image series, co-registration of each series with each other, and blood pool segmentation. Note that color scales are different for pre and post contrast examples.
Figure 3
Figure 3
Example T1-maps acquired pre- (left) and post- (center) contrast and automatic segmentation mask (right) used to estimate T1-values of blood for ECV calculation. Manually drawn blood pool ROIs were used for comparison with automatic segmentation estimates.
Figure 4
Figure 4
Quality of ECV maps was scored on a scale of 1–5 for N = 600 maps across 338 subjects. ECV map images are provided as examples for each quality category.
Figure 5
Figure 5
Performance of motion correction of T1-maps and co-registration for ECV-maps was scored as to whether or not there was visually detectable improvement or degradation.
Figure 6
Figure 6
Example case of post-contrast T1-maps acquired with significant respiratory motion which is significantly improved by MOCO, particularly in the septal region (arrows). Residual errors from exponential model fit (arbitrary signal intensity units) are plotted versus inversion time for a pixel at the edge of the septum (left) and a pixel at the center of the septum (right) before (non-MOCO) and after MOCO.
Figure 7
Figure 7
Example case for which co-registration of data between pre- and post-contrast T1-maps acquisitions was critical. In these examples, MOCO co-registration of the respective maps markedly improved the ECV map, eliminating an artifactually high ECV in the inferior septum (arrows) in the non-co-registered maps. MOCO did not improve the quality of individual (pre- and post-contrast) T1-maps for this example, however MOCO + co-registration was significantly improved.
Figure 8
Figure 8
Measured ECV values (n = 62 subjects) for normal myocardium measured in the mid-wall of the myocardium with and without motion correction and co-registration showing that motion correction significantly reduces variability (p < 0.001). Box and whisker plots show median, 25 and 75 percentiles, and range.

References

    1. Pennell DJ, Sechtem UP, Higgins CB. et al. Clinical indications for cardiovascular magnetic resonance (CMR): Consensus Panel report. EurHeart J. 2004;25:1940–1965. - PubMed
    1. Hunold P, Schlosser T, Vogt FM. et al. Myocardial late enhancement in contrast-enhanced cardiac MRI: distinction between infarction scar and non-infarction-related disease. Am J Roentgenol. 2005;184(5):1420–1426. - PubMed
    1. Sado DM, Flett AS, Moon JC. Novel imaging techniques for diffuse myocardial fibrosis. Future Cardiol. 2011;7(5):643–650. doi: 10.2217/fca.11.45. - DOI - PubMed
    1. Mewton N, Liu CY, Croisille P, Bluemke D, Lima JA. Assessment of myocardial fibrosis with cardiovascular magnetic resonance. J Am Coll Cardiol. 2011;57(8):891–903. doi: 10.1016/j.jacc.2010.11.013. - DOI - PMC - PubMed
    1. Gai N, Turkbey EB, Nazarian S. et al. T1 mapping of the gadolinium-enhanced myocardium: adjustment for factors affecting interpatient comparison. Magn Reson Med. 2011;65(5):1407–1415. doi: 10.1002/mrm.22716. - DOI - PMC - PubMed

Publication types