. 2013 Jan;15(1):63-81.
doi: 10.1111/cmi.12026. Epub 2012 Oct 4.

Regulation of Toll-like receptor 2 interaction with Ecgp96 controls Escherichia coli K1 invasion of brain endothelial cells

Affiliations

Regulation of Toll-like receptor 2 interaction with Ecgp96 controls Escherichia coli K1 invasion of brain endothelial cells

Subramanian Krishnan et al. Cell Microbiol. 2013 Jan.

Abstract

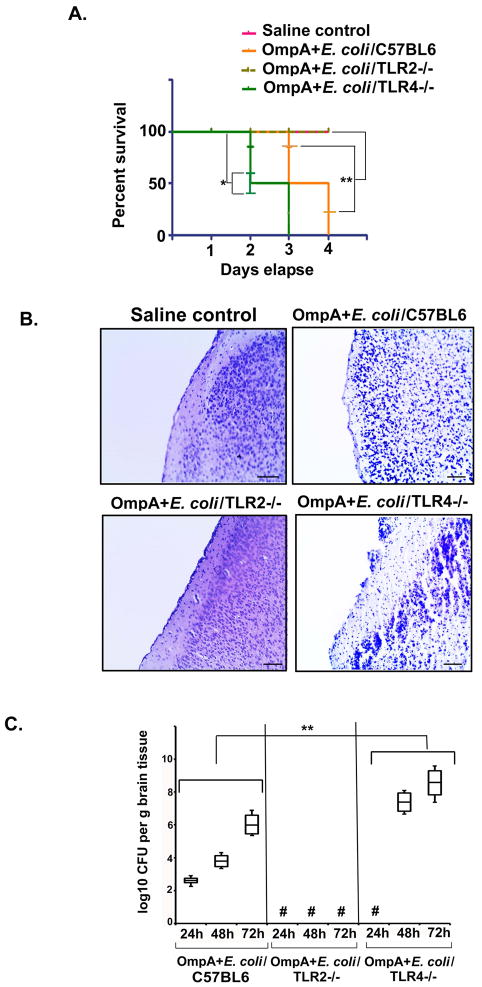
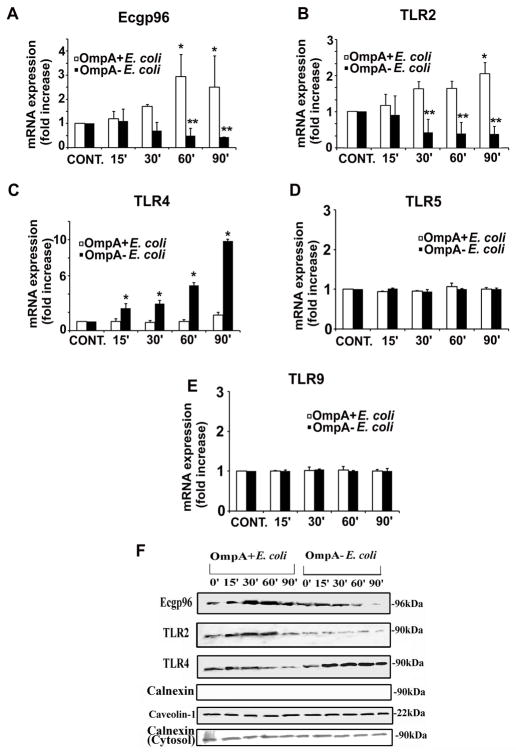
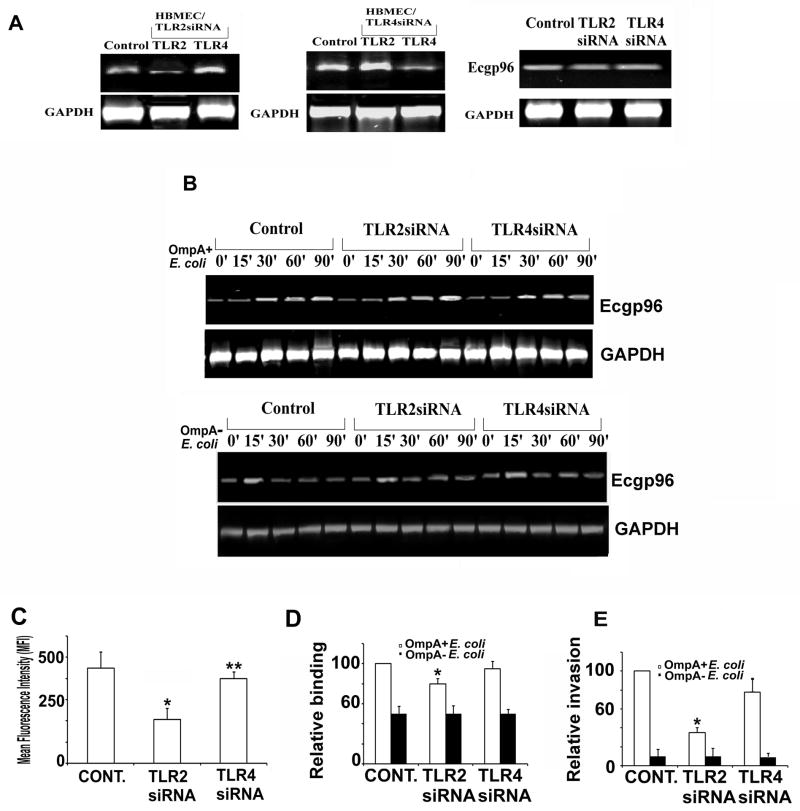
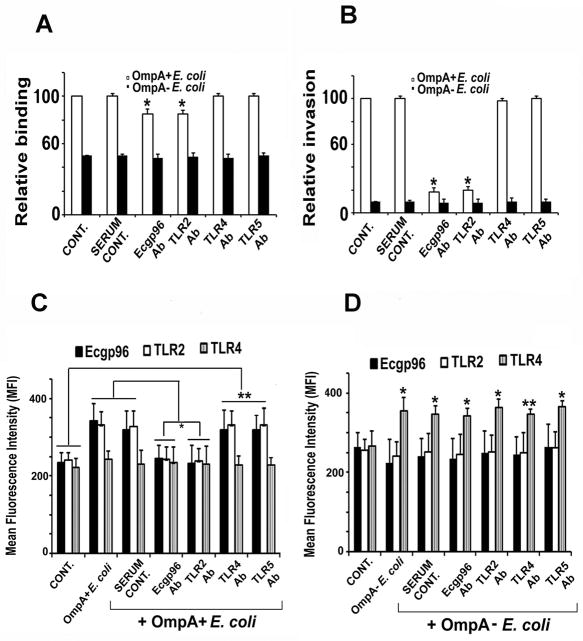
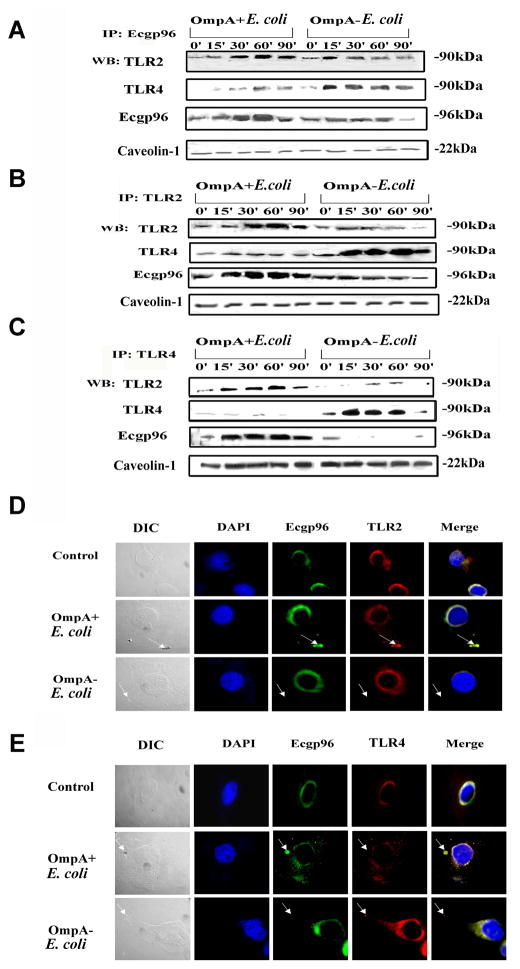
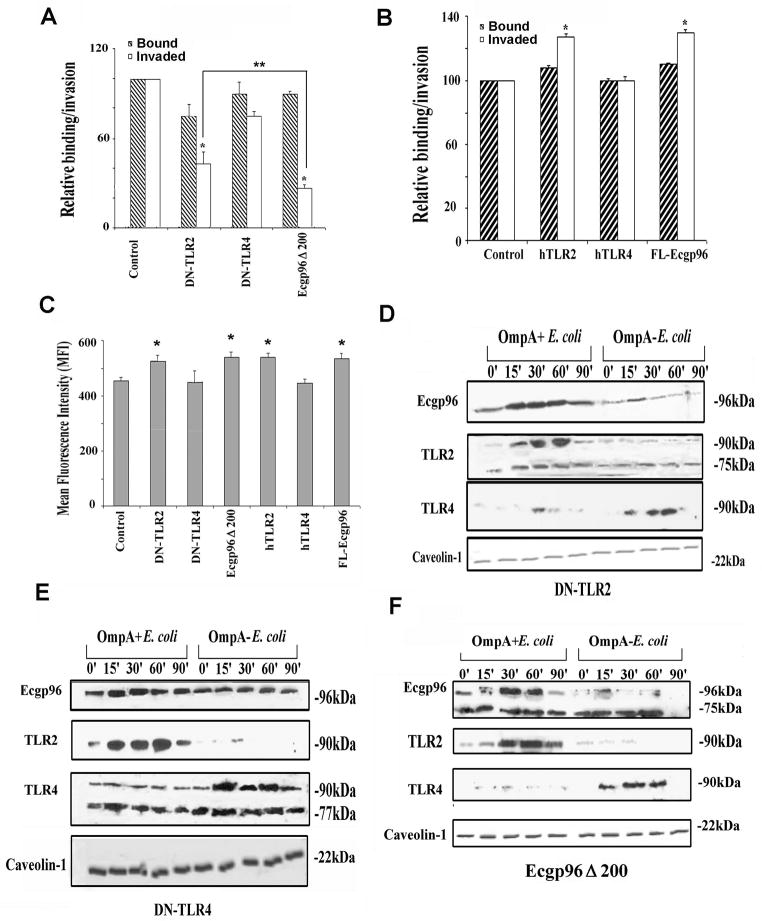
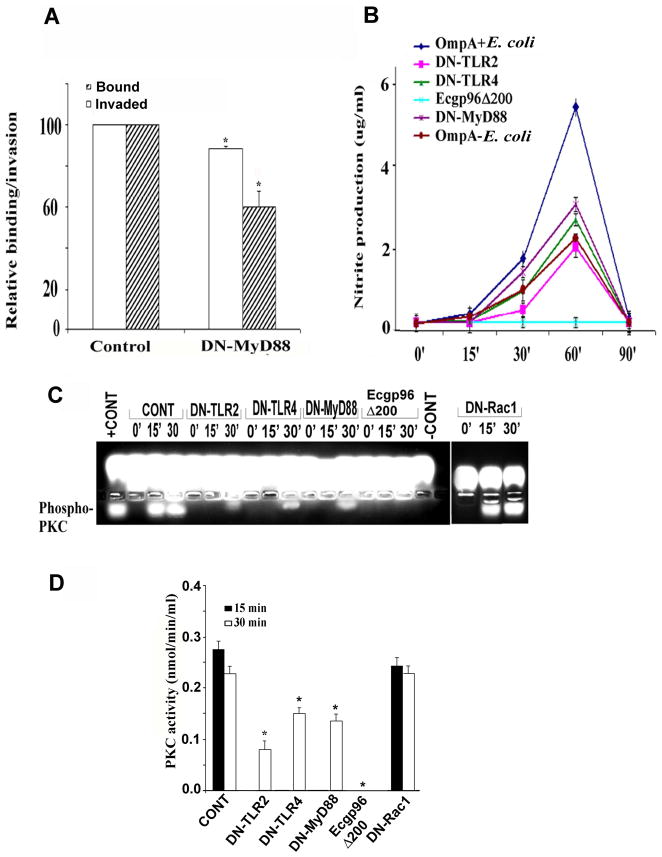
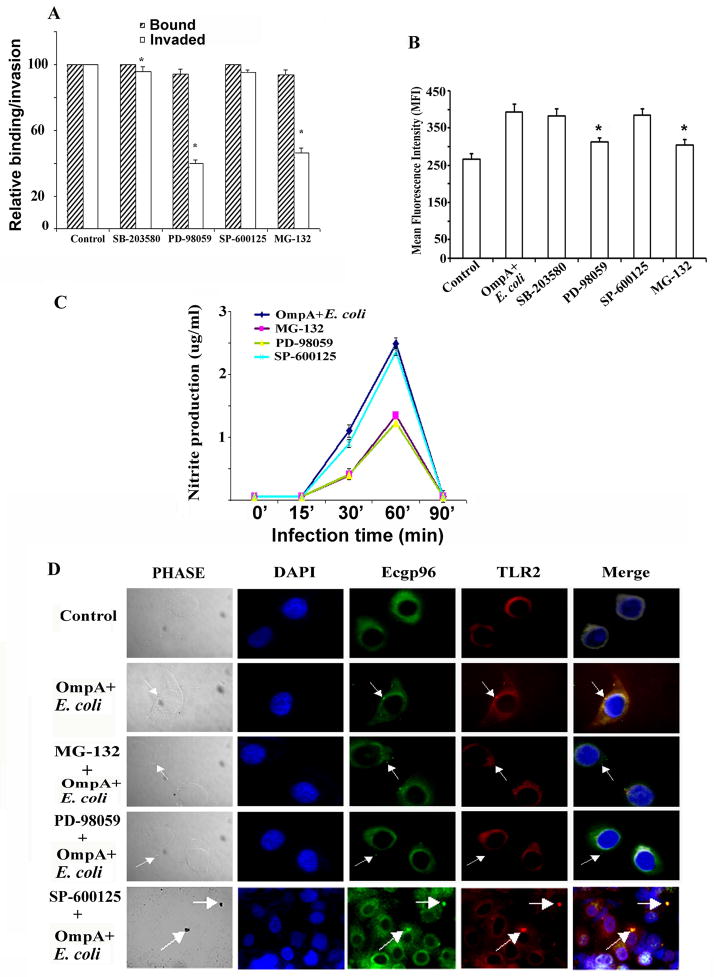
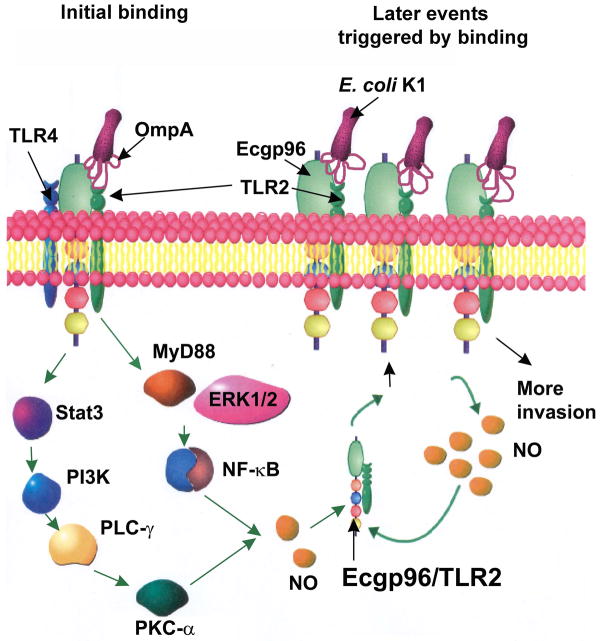
The interaction of outer membrane protein A (OmpA) with its receptor, Ecgp96 (a homologue of Hsp90β), is critical for the pathogenesis of Escherichia coli K1 meningitis. Since Hsp90 chaperones Toll-like receptors (TLRs), we examined the role of TLRs in E. coli K1 infection. Herein, we show that newborn TLR2(-/-) mice are resistant to E. coli K1 meningitis, while TLR4(-/-) mice succumb to infection sooner. In vitro, OmpA+ E. coli infection selectively upregulates Ecgp96 and TLR2 in human brain microvascular endothelial cells (HBMEC), whereas OmpA- E. coli upregulates TLR4 in these cells. Furthermore, infection with OmpA+ E. coli causes Ecgp96 and TLR2 translocate to the plasma membrane of HBMEC as a complex. Immunoprecipitation studies of the plasma membrane fractions from infected HBMEC reveal that the C termini of Ecgp96 and TLR2 are critical for OmpA+ E. coli invasion. Knockdown of TLR2 using siRNA results in inefficient membrane translocation of Ecgp96 and significantly reduces invasion. In addition, the interaction of Ecgp96 andTLR2 induces a bipartite signal, one from Ecgp96 through PKC-α while the other from TLR2 through MyD88, ERK1/2 and NF-κB. This bipartite signal ultimately culminates in the efficient production of NO, which in turn promotes E. coli K1 invasion of HBMEC.


Conflict of interest statement

All the authors have no conflict of interest.

Figures

Figure 1
Figure 1. TLR2−/− mice are resistant to E. coli K1 meningitis
(A) 3 day old C57BL6 (n=12), TLR2−/− (n=15) and TLR4−/− (n=15) pups were infected intranasally with 103 CFU of OmpA+ E. coli. Another set of 3 day old C57BL6 (n=11) received pyrogen free saline and served as controls, where “n” is number animals used per group. The pups were monitored for survival at 24 h, 48 h, 72 h and 96 h post-infection. Percent survival of the pups at the given time points are presented as Kaplan Meier curve. All pups were sacrificed if they were in moribund state due to ethical reasons. Percent survival of C57BL6 and TLR4−/− mice was statistically significant (*P<0.01 and **P<0.02 with respect to saline control by Student’s t test). (B) Control and infected pups were euthanized at 72 h post-infection and half of the brain samples were processed as described in experimental procedures, and stained with H and E. Scale bar = 100 μm. Arrows indicate either loss of meninges or neutrophil infiltration. (C) The other half of the brain was homogenized in saline, serial dilution made and plated on LB agar with rifampicin. Three animals from these experiments were used to determine the bacterial load in the brains at 24, 48 and 72 h post-infection. The results are representative of three different experiments. Asterisks represent lack of bacterial colonies in the brains. Fold increase in log CFU between control and TLR4−/− groups was statistically significant for each time point (**P<0.001 by ANOVA). # indicates no bacteria recovered from the brains.
Figure 2
Figure 2. Expression of Ecgp96 and TLRs in HBMEC in response to E. coli K1 infection
(A) Confluent monolayers of HBMEC in 6-well culture plates were infected with OmpA+ E. coli or OmpA− E. coli for various time points as indicated. Total RNA was isolated, cDNA prepared and subjected to real time qPCR using primers for Ecgp96 (A), TLR2 (B), TLR4 (C), TLR5 (D), TLR9 (E), and GAPDH. Fold increase in mRNA expression was graphed after normalized to GAPDH. The error bars represent means ± SD from three independent experiments performed in duplicate and the fold increase/decrease in transcript levels of Ecgp96, TLR2 and TLR4 was statistically significant, *P<0.01, *P<0.01 and *P<0.0001 respectively by Student’s t test. (F) HBMEC grown in 100 mm dishes were treated with OmpA+ E. coli or OmpA− E. coli for indicated time points and the membrane fractions were prepared. Equal amounts of membrane proteins were subjected to Western blotting with antibodies to Ecgp96, TLR2, TLR4, Calnexin or Caveolin-1. Equal amounts of cytosolic fractions were also subjected to Western blotting using antibodies to Calnexin.
Figure 3
Figure 3. TLR2 knockdown by siRNA affects the surface expression of Ecgp96
(A) HBMEC in 6-well plates were transfected with either TLR2 or TLR4 siRNA at 90% confluence, allowed to recover for 24 h, total RNA was isolated and subjected to RT-PCR with primers specific to tlr2, tlr4, ecgp96, or gapdh. ‘Control’ indicates untransfected HBMEC. (B) In separate experiments, the transfectants were infected with OmpA+ E. coli or OmpA− E. coli for indicated periods; total RNA was isolated and subjected to RT-PCR with ecgp96 primers. Expression of gapdh was used as a control for normalization. (C) Flow cytometry of HBMEC transfected with TLR2 or TLR4 siRNA was performed with anti-Ecgp96 antibodies. The data represent mean fluorescence intensities (MFI) after subtracting the isotype matched control values. The decrease in the expression of Ecgp96 in TLR2 siRNA transfected HBMEC as compared to untransfected control was statistically significant, *P<0.01 by Student’s t test, whereas the expression of Ecgp96 in TLR4 siRNA transfected HBMEC was similar compared to untransfected HBMEC and not statistically significant, **P=0.15 by Student’s t test. In separate experiments, the transfected HBMEC were subjected to binding (D) or invasion assays (E). The data represent mean ± SD from three different experiments performed in triplicate. Relative binding or invasion was expressed with respect to control cell values taken as 100%. The increase or decrease in binding or invasion is statistically significant compared control cells,*P<0.01 by Student’s t test.
Figure 4
Figure 4. Effect of antibodies to Ecgp6 and TLRs on the binding, invasion and surface expression of Ecgp96
HBMEC grown in 24 well plates to confluence were pre-incubated with normal serum or antibodies to Ecgp96, TLR2, TLR4 or TLR5 for 1 h and then infected with OmpA+ E. coli K1. Bound (A) or invaded (B) bacteria were determined as described in Methods sections. Data represent mean ± SD from three different experiments performed in triplicate. Relative binding or invasion was expressed with respect to control cell values taken as 100%. The decrease in binding and invasion of E. coli was statistically significant compared with control, *P<0.01 by Student’s t test. In separate experiments, HBMEC were pre-treated with respective antibodies for 1 h prior to infection with OmpA+ E. coli and subjected to flow cytometry analysis using antibodies to Ecgp96, TLR2 or TLR4. Increase or decrease in the expression of the respective proteins in the presence of various antibodies were statistically significant compared to control (*P<0.05 by Student’s t test).
Figure 5
Figure 5. Association of TLR2 with Ecgp96 at the surface of HBMEC upon infection with OmpA+ E. coli
60 μg of membrane fractions of HBMEC, infected with OmpA+ E. coli and OmpA− E. coli for indicated time points, were immunoprecipitated with anti-Ecgp96 antibodies (A), anti-TLR2 antibodies (B) or anti-TLR4 antibodies (C) and the resulting immune complexes were subjected to Western blotting using antibodies to TLR2, TLR4 and Ecgp96. To evaluate equality of loading, 10 μg of membrane proteins were subjected to Western blotting with anti-Caveolin-1 antibodies. (D) HBMEC were infected with OmpA+ E. coli or OmpA− E. coli for 30 min in 8-well chamber slides, fixed and stained with anti-Ecgp96 antibodies followed by Alexa 488 coupled secondary antibody. The cells were also stained with anti-TLR2 antibody followed by Alexa 568 coupled secondary antibody. (E) Similarly, in separate experiments, HBMEC infected with the bacteria were stained with anti-Ecgp96 antibodies and anti-TLR4 antibodies. Arrows indicate the position of bacteria and respective accumulation of Ecgp96, TLR2 or TLR4. (Magnification: 63X).
Figure 6
Figure 6. Effect of overexpression of dominant negative constructs of Ecgp96, TLR2 or TLR4 on OmpA+ E. coli invasion and on the surface expression of Ecgp6
(A) HBMEC transfected with DN-TLR2, DN-TLR4, or Ecgp96Δ200 were grown to confluence, and used for binding and invasion assays. The data presented are mean ± SD from three different experiments performed in triplicate. Relative bound/invaded values were expressed with respect to control values taken as 100%. The decrease in the invasion was statistically significant, *P<0.03 by Student’s t test. The difference in invasion between DN-TLR2 and DN-TLR4 transfected HBMEC was also statistically significant, **P<0.05 by Student’s t test. (B) HBMEC transfected with hTLR2, hTLR4 or FL-Ecgp96 plasmids were grown to confluence, and used for total cell associated and invasion assays. The data presented are mean ± SD from four different experiments performed in triplicate. The increase in the invasion was statistically significant in comparison to control cells, *P<0.02 by Student’s t test. (C) HBMEC were subjected to flow cytometry 24 h after transfection with the respective plasmids and probed with anti-Ecgp96 antibody followed by Alexa 488 coupled secondary antibody to analyze the surface expression of Ecgp96. Values represent mean fluorescence intensities (MFI) after subtracting values obtained from isotype-matched control antibody. The data represent mean ± SD from three different experiments. The increase or decrease in Ecgp96 expression is statistically significant compared to the expression in control cells, *P<0.05 by Student’s t test. DN-TLR2 (D), DN-TLR4 (E) or Ecgp96Δ200 (F) transfected HBMEC were infected with OmpA+ E. coli or OmpA− E. coli for indicated time points. HBMEC membranes were prepared and 60 μg of the proteins were immunoprecipitated with anti-Ecgp96 antibody. The immune complexes were then subjected to Western blot analysis with antibodies to TLR2 and TLR4. In a separate gel, equal amounts of plasma membrane proteins used for immunoprecipitation studies were subjected to Western blotting with anti-caveolin-1 antibody.
Figure 7
Figure 7. Overexpression of dominant negative-TLR2, -TLR4 or -MyD88 inhibits the production of nitric oxide and activation of PKC-α
(A) HBMEC transfected with DN-MyD88 or plasmid alone (control) were grown to confluence and used for binding and invasion assays. The data represent means ± SD from three different experiments performed in triplicate. Relative bound/invaded values were expressed with respect to control cell values taken as 100%. The reduction in the cell association and invasion of E. coli in DN-MyD88/HBMEC was statistically significant compared with plasmid-alone transfected cells, *P<0.02 by Student’s t test. (B) HBMEC transfected with various plasmid constructs were infected with OmpA+ E. coli for varying time points, supernatants were collected and analyzed for NO production as mentioned in Experimental Procedures. The data represent mean ± SD from three different experiments performed in triplicate. (C) HBMEC transfected with various plasmids were infected with OmpA+ E. coli for 0, 15 or 30 min, total cell lysates were prepared, and subjected for PKC substrate phosphorylation assay using PepTag non-radioactive kit. +ve represents the positive standard provided by the manufacturer. −ve represents a reaction performed without cell lysates. (D) Spectrophotometric analysis of phosphorylated PKC substrate bands was determined as described in Experimental Procedures. The reduction in the phosphorylation of PKC substrate in DN-TLR2, DN-TLR4, DN-MyD88 and Ecgp96Δ200 transfected and E. coli K1 infected HBMEC was statistically significant, *P<0.05 by Student’s t test.
Figure 8
Figure 8. ERK1/2 and NF-κB inhibitors prevent the invasion of OmpA+ E. coli in HBMEC by reducing the production of NO
(A) HBMEC were pre-treated with various inhibitors for 30 min before performing invasion assays with OmpA+ E. coli. The data presented are mean ± SD from three different experiments performed in triplicate. Relative bound/invaded values were expressed with respect to control values taken as 100%. Inhibitors of ERK1/2 and NF-κB significantly reduced the invasion compared with control cells, *P<0.01 by t test. (B) HBMEC were pre-treated with various inhibitors for 30 min, infected with OmpA+ E. coli and subjected to flow cytometry. The experiment was performed three times and reduction in Ecgp96 levels in PD-98059 and MG-132 treated HBMEC was statistically significant (*P<0.05 by Student’s t test). (C) HBMEC were pre-treated with various inhibitors for 30 min and infected with OmpA+ E. coli for different time points. Supernatants were collected and analyzed for NO production as nitrite by Griess method. The values represent mean ± SD from three different experiments performed in triplicate. (D) In separate experiments, pre-treated and infected HBMEC in 8-well chamber slides were subjected to immunocytochemistry with anti-Ecgp96 and anti-TLR2 antibodies. (Magnification: 63X). Arrows indicate the position of the bacteria or the accumulation of Ecgp96 or TLR2.
Figure 9
Figure 9. A proposed model for E. coli K1 invasion of HBMEC mediated by OmpA and Ecgp96/TLR2 interaction
At the initial stages of infection, HBMEC express Ecgp96/TLR2/ TLR4 complex on the cell surface. E. coli K1 interaction with Ecgp96 on HBMEC mediated by OmpA induced activation of PKC-α via Stat3, PLC-γ, PI3K, which results in the production of NO. Similarly, OmpA interaction with Ecgp96/TLR2 complex activates MyD88 and ERK1/2 followed by NF-κB, which also produces NO. Recruitment of MyD88 induces more association of PKC-α to the complex and triggers more NO production, which induces the translocation of additional Ecgp96/TLR2 complexes to the membrane. These additional Ecgp96/TLR2 complexes act as receptors for the binding of more bacteria and thereby promote increased invasion of E. coli K1.

Similar articles

Cited by

References

    1. Aletayeb MH, Ahmad FS, D Masood. An 11-year study of causes of neonatal bacterial meningitis in Ahvaz, Iran. Pediatr Int. 2010;52:463–466. - PubMed
    1. Andonegui G, Zhou H, Bullard D, Kelly MM, Mullaly SC, McDonald B, et al. Mice that exclusively express TLR4 on endothelial cells can efficiently clear a lethal systemic Gram-negative bacterial infection. J Clin Invest. 2009;119:1921–1930. - PMC - PubMed
    1. Banerjee PP, Vinay DS, Mathew A, Raje M, Parekh V, Prasad DV, et al. Evidence that glycoprotein 96 (B2), a stress protein, functions as a Th2-specific costimulatory molecule. J Immunol. 2002;169:3507–3518. - PubMed
    1. Cabanes D, Sousa S, Cebria A, Lecuit M, Garcia-del Portillo F, Cossart P. Gp96 is a receptor for a novel Listeria monocytogenes virulence factor, Vip, a surface protein. Embo J. 2005;24:2827–2838. - PMC - PubMed
    1. Carmody RJ, Chen YH. Nuclear factor-kappaB: activation and regulation during toll-like receptor signaling. Cell Mol Immunol. 2007;4:31–41. - PubMed

Publication types

MeSH terms