. 2012 Dec;26(12):5092-105.
doi: 10.1096/fj.12-212399. Epub 2012 Sep 10.

Mapping spatial approximations between the amino terminus of secretin and each of the extracellular loops of its receptor using cysteine trapping

Affiliations

Mapping spatial approximations between the amino terminus of secretin and each of the extracellular loops of its receptor using cysteine trapping

Maoqing Dong et al. FASEB J. 2012 Dec.

Abstract

While it is evident that the carboxyl-terminal region of natural peptide ligands bind to the amino-terminal domain of class B GPCRs, how their biologically critical amino-terminal regions dock to the receptor is unclear. We utilize cysteine trapping to systematically explore spatial approximations among residues in the first five positions of secretin and in every position within the receptor extracellular loops (ECLs). Only Cys(2) and Cys(5) secretin analogues exhibited full activity and retained moderate binding affinity (IC(50): 92±4 and 83±1 nM, respectively). When these peptides probed 61 human secretin receptor cysteine-replacement mutants, a broad network of receptor residues could form disulfide bonds consistent with a dynamic ligand-receptor interface. Two distinct patterns of disulfide bond formation were observed: Cys(2) predominantly labeled residues in the amino terminus of ECL2 and ECL3 (relative labeling intensity: Ser(340), 94±7%; Pro(341), 84±9%; Phe(258), 73±5%; Trp(274) 62±8%), and Cys(5) labeled those in the carboxyl terminus of ECL2 and ECL3 (Gln(348), 100%; Ile(347), 73±12%; Glu(342), 59±10%; Phe(351), 58±11%). These constraints were utilized in molecular modeling, providing improved understanding of the structure of the transmembrane bundle and interconnecting loops, the orientation between receptor domains, and the molecular basis of ligand docking. Key spatial approximations between peptide and receptor predicted by this model (H(1)-W(274), D(3)-N(268), G(4)-F(258)) were supported by mutagenesis and residue-residue complementation studies.


Figures

Figure 1.
Figure 1.
Functional characterization of cysteine-containing secretin analogues. Top panel: amino acid sequences of natural human secretin and its analogues incorporating a cysteine in amino-terminal positions 1 through 5. Natural residues are illustrated in gray, while modified residues are illustrated in black. Bottom left panel: curves of increasing concentrations of secretin and each of the cysteine-containing analogues to compete for the binding of the secretin radioligand to CHO-SecR cells. Values represent percentages of saturable binding, expressed as the means ± se of duplicate values from ≥3 independent experiments. Bottom right panel: concentration-dependent intracellular cAMP responses to each of these peptides. Data points represent mean ± se of 3 independent experiments performed in duplicate, normalized relative to the maximal responses to secretin in these cells.
Figure 2.
Figure 2.
Cell surface expression of secretin receptor mutants that exhibited no saturable binding. COS-1 cells transiently expressing each of the noted secretin receptor mutant constructs were analyzed by flow cytometry using an amino-terminal region secretin receptor antibody (18). Data represent percentage expression levels of each mutant relative to wild type receptor, expressed as means ± se of 3 independent experiments.
Figure 3.
Figure 3.
Disulfide trapping of Cys5-sec and Cys2-sec to secretin receptor cysteine mutants. Shown are typical autoradiographs of 10% SDS-PAGE gels used to separate the products of cysteine trapping of indicated receptor mutants expressed in COS-1 cells by Cys5-sec (left panels) and Cys2-sec (right panels) in the absence (top panels of each pair) and presence (bottom panels of each pair) of reducing agent (DTT). Between the autoradiographs are bar graphs representing the efficiency of labeling of residues within each of the ECL regions as percentages of the band in that ECL with highest labeling intensity using densitometric data from 3 independent cysteine trapping experiments (quantitation in Table 2). Since no bands were observed for Cys5-sec labeling of ECL1 residues, no densitometry was included. All gels for ECL1 labeling were exposed for autoradiography for 8–9 d. For ECL2 labeling, the nonreduced gels were exposed for 4–5 d, and the reduced gels were exposed for 8 d. For ECL3 labeling, the nonreduced gels for Cys5–sec labeling were exposed for 3 d, while those for Cys2–sec labeling were exposed for 3–4 d, and all the reduced gels were exposed for 8 d. Table 2 also includes overall efficiency of labeling of residues by each of the probes, normalized relative to the labeling intensity of the residue within any of the three loops that was labeled most efficiently.
Figure 4.
Figure 4.
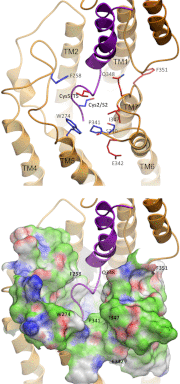
Experimentally determined spatial approximations in secretin receptor model. Top panel: labeled residues. Modeled secretin receptor (orange ribbon and sticks) and peptide (magenta ribbon) are displayed with the key residues that were labeled by Cys2-sec (blue sticks: F258, W274, S340, and P341) and Cys5-sec (red sticks: E342, I347, Q348, and F351) probes. Bottom panel: binding pocket. Modeled secretin receptor (orange ribbon and sticks) and peptide (magenta ribbon) are displayed with the pocket surface colored based on its binding properties (white, neutral; green, hydrophobic; red, hydrogen bonding acceptor potential; blue, hydrogen bonding donor potential).
Figure 5.
Figure 5.
Predicted spatial approximations within secretin receptor model. Panels show those receptor residues (W274, panel A; N268, panel B; and F258, panel C; displayed in thick orange stick) that are predicted to interact with secretin residues in positions 1, 3, and 4 (H1, panel A; D3, panel B; and G4, panel C; displayed in magenta stick), representing the secretin residues within the peptide amino terminus that were shown to be difficult to replace with alanine or cysteine in structure-activity studies. A) Proposed interaction between peptide residue H1 and receptor residue W274 is most compatible with a hydrophobic interaction. B) Proposed interaction between D3 and N268 involves a hydrogen bond (green spheres). B) G4 is proposed to be closest to F258. Other neighboring residues within 5 Å of each peptide residue are also displayed, using thin orange stick.
Figure 6.
Figure 6.
Functional characterization of secretin receptor ECL2 mutants. Left panels: secretin competition-binding curves for COS-1 cells transfected with WT and mutant secretin receptor constructs (top panel: alanine-replacement mutants; bottom panel: conserved substitution). Values are percentages of saturable binding, expressed as means ± se of duplicate values from ≥3 independent experiments. Right panels: concentration-dependent intracellular cAMP responses to secretin in these cells, with values corresponding to means ± se of 3 independent experiments performed in duplicate, normalized relative to the maximal responses to secretin in these cells. Basal (5.4±1.1 pmol/106 cells) and maximal (210±56 pmol/106 cells) cAMP levels were similar for all secretin receptor constructs tested.
Figure 7.
Figure 7.
Complementary mutagenesis data. Left panels: secretin competition-binding curves for COS-1 cells transfected with WT and alanine- or cysteine-replacement secretin receptor constructs. Values are percentages of saturable binding, expressed as means ± se of duplicate values from ≥3 independent experiments. Right panels: concentration-dependent intracellular cAMP responses to secretin in these cells, with values corresponding to mean ± se of 3 independent experiments performed in duplicate, normalized relative to the maximal responses to secretin in these cells. Basal (5.4±1.1 pmol/106 cells) and maximal (205±12 pmol/106 cells) cAMP levels were similar for all secretin receptor constructs tested.

References

    1. Mayo K. E., Miller L. J., Bataille D., Dalle S., Goke B., Thorens B., Drucker D. J. (2003) International Union of Pharmacology. XXXV. The glucagon receptor family. Pharmacol. Rev. 55, 167–194 - PubMed
    1. Shoichet B. K., Kobilka B. K. (2012) Structure-based drug screening for G-protein-coupled receptors. Trends Pharmacol. Sci. 33, 268–272 - PMC - PubMed
    1. Dong M., Lam P. C., Pinon D. I., Hosohata K., Orry A., Sexton P. M., Abagyan R., Miller L. J. (2011) Molecular basis of secretin docking to its intact receptor using multiple photolabile probes distributed throughout the pharmacophore. J. Biol. Chem. 286, 23888–23899 - PMC - PubMed
    1. Parthier C., Reedtz-Runge S., Rudolph R., Stubbs M. T. (2009) Passing the baton in class B GPCRs: peptide hormone activation via helix induction? Trends Biochem. Sci. 34, 303–310 - PubMed
    1. Chen Q., Pinon D. I., Miller L. J., Dong M. (2010) Spatial approximations between residues 6 and 12 in the amino-terminal region of glucagon-like peptide 1 and its receptor: a region critical for biological activity. J. Biol. Chem. 285, 24508–24518 - PMC - PubMed

Publication types

MeSH terms

LinkOut - more resources