

Progress in the diagnosis of appendicitis: a report from Washington State's Surgical Care and Outcomes Assessment Program
- PMID: 22964731
- PMCID: PMC3475492
- DOI: 10.1097/SLA.0b013e31826a9602
Progress in the diagnosis of appendicitis: a report from Washington State's Surgical Care and Outcomes Assessment Program
Abstract
Background and objectives: Studies suggest that computed tomography and ultrasonography can effectively diagnose and rule out appendicitis, safely reducing negative appendectomies (NAs); however, some within the surgical community remain reluctant to add imaging to clinical evaluation of patients with suspected appendicitis. The Surgical Care and Outcomes Assessment Program (SCOAP) is a physician-led quality initiative that monitors performance by benchmarking processes of care and outcomes. Since 2006, accurate diagnosis of appendicitis has been a priority for SCOAP. The objective of this study was to evaluate the association between imaging and NA in the general community.
Methods: Data were collected prospectively for consecutive appendectomy patients (age > 15 years) at nearly 60 hospitals. SCOAP data are obtained directly from clinical records, including radiological, operative, and pathological reports. Multivariate logistic regression models were used to examine the association between imaging and NA. Tests for trends over time were also conducted.
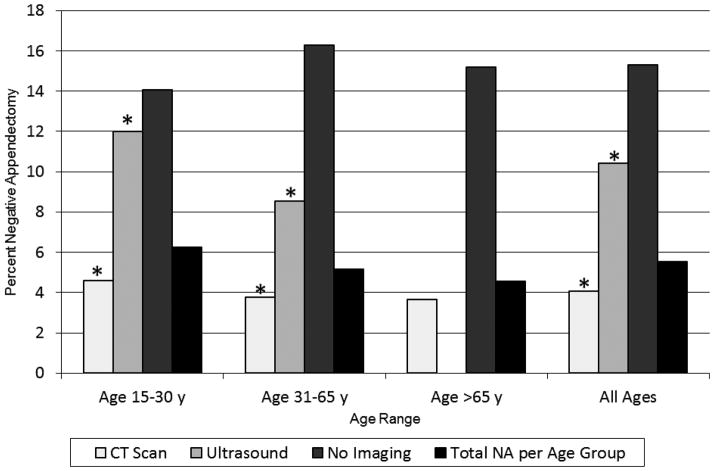
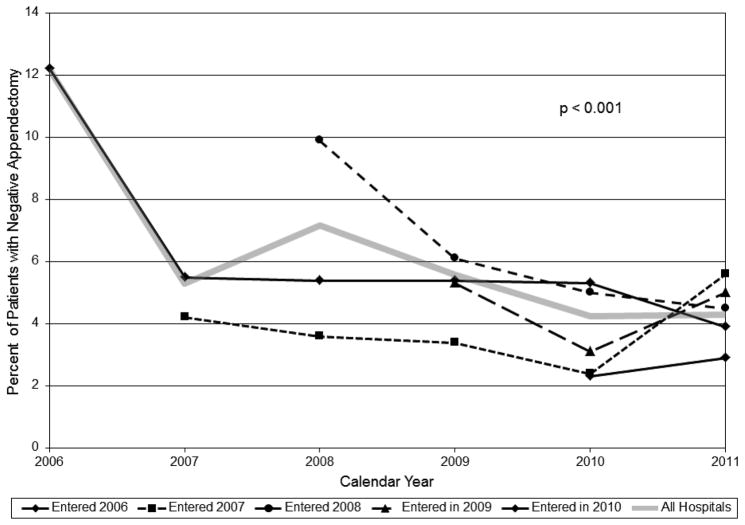
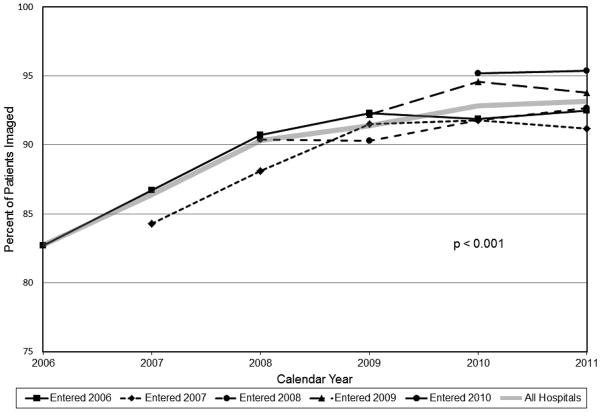
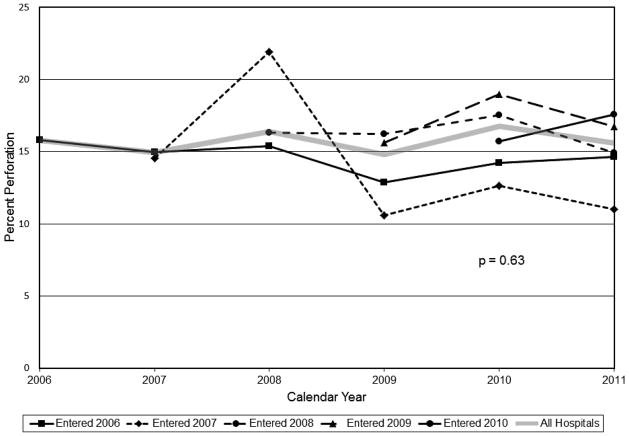
Results: Among 19,327 patients (47.9% female) who underwent appendectomy, 5.4% had NA. Among patients who were imaged, frequency of NA was 4.5%, whereas among those who were not imaged, it was 15.4% (P < 0.001). This association was consistent for men (3% vs 10%, P < 0.001) and for women of reproductive age (6.9% vs 24.7%, P < 0.001). In a multivariate model adjusted for age, sex, and white blood cell count, odds of NA for patients not imaged were 3.7 times the odds for those who received imaging (95% CI: 3.0-4.4). Among SCOAP hospitals, use of imaging increased and NA decreased significantly over time; frequency of perforation was unchanged.
Conclusions: Patients who were not imaged during workup for suspected appendicitis had more than 3 times the odds of NA as those who were imaged. Routine imaging in the evaluation of patients suspected to have appendicitis can safely reduce unnecessary operations. Programs such as SCOAP improve care through peer-led, benchmarked practice change.
Figures
Comment in
-
Reply to letter: "Progress in the diagnosis of appendicitis".Ann Surg. 2015 Mar;261(3):e88-9. doi: 10.1097/SLA.0000000000000497. Ann Surg. 2015. PMID: 24441805 Free PMC article. No abstract available.
-
Progress in the diagnosis of appendicitis.Ann Surg. 2015 Mar;261(3):e88. doi: 10.1097/SLA.0000000000000498. Ann Surg. 2015. PMID: 24513786 No abstract available.
References
-
- Rettenbacher T, Hollerweger A, Gritzmann N, et al. Appendicitis: should diagnostic imaging be performed if the clinical presentation is highly suggestive of the disease? Gastroenterology. 2002;123(4):992–8. - PubMed
-
- Lee CC, Golub R, Singer AJ, et al. Routine versus selective abdominal computed tomography scan in the evaluation of right lower quadrant pain: a randomized controlled trial. Acad Emerg Med. 2007;14(2):117–22. - PubMed
-
- Santos DA, Manunga J, Jr, Hohman D, et al. How often does computed tomography change the management of acute appendicitis? Am Surg. 2009;75(10):918–21. - PubMed
-
- Applegate KE, Sivit CJ, Salvator AE, et al. Effect of cross-sectional imaging on negative appendectomy and perforation rates in children. Radiology. 2001;220(1):103–7. - PubMed
-
- Bendeck SE, Nino-Murcia M, Berry GJ, et al. Imaging for suspected appendicitis: negative appendectomy and perforation rates. Radiology. 2002;225(1):131–6. - PubMed
Publication types
MeSH terms
Grants and funding
LinkOut - more resources
Full Text Sources
Other Literature Sources
Medical
