Comparative Study
. 2013 Jun;37(6):853-60.
doi: 10.1038/ijo.2012.141. Epub 2012 Sep 11.

Increased adipose tissue hypoxia and capacity for angiogenesis and inflammation in young diet-sensitive C57 mice compared with diet-resistant FVB mice

Affiliations
Comparative Study

Increased adipose tissue hypoxia and capacity for angiogenesis and inflammation in young diet-sensitive C57 mice compared with diet-resistant FVB mice

D-H Kim et al. Int J Obes (Lond). 2013 Jun.

Abstract

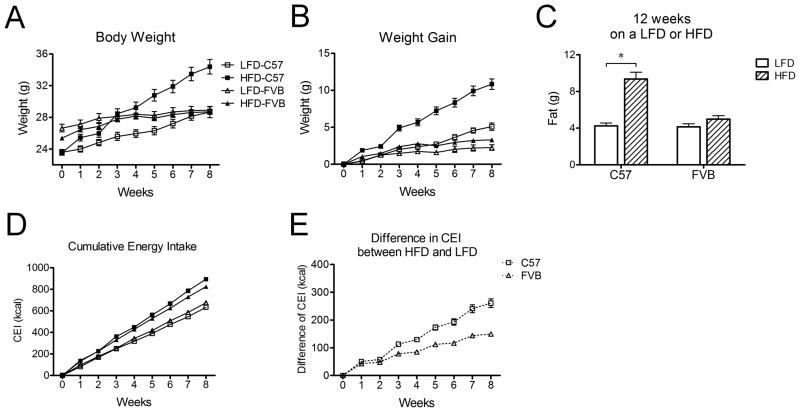
Objective: High-fat diets (HFDs) result in increased body weight. However, this is not uniform and determining the factors that make some animals or individual more susceptible to this diet-induced weight gain is a critical research question. The expansion of white adipose tissue (WAT) associated with weight gain requires high rates of angiogenesis to support the expanding tissue mass. We hypothesized that diet-induced obese (DIO) mice have a greater capacity for WAT angiogenesis and remodeling than diet-resistant (DR) mice at a young age, before age or DIO.

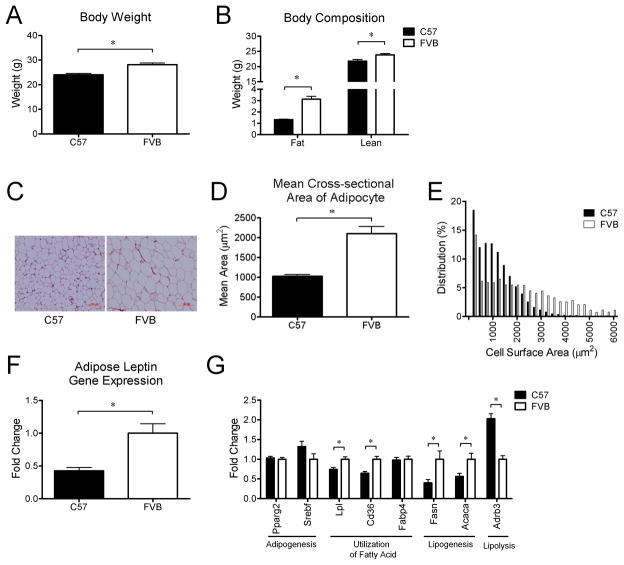
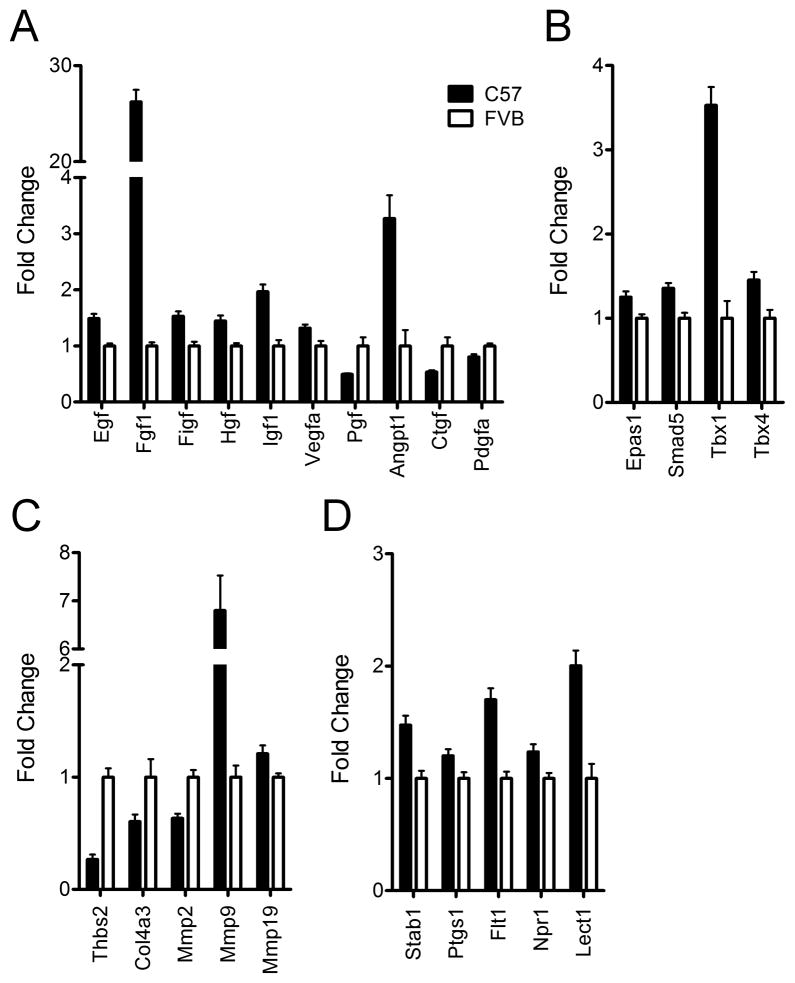
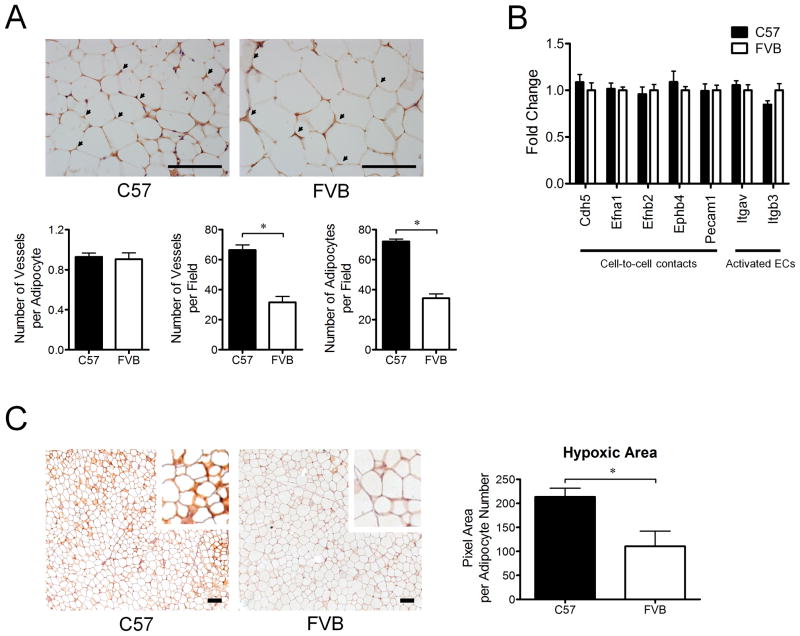
Design: We measured body weight and body composition by nuclear magnetic resonance. We compared the expression of genes related to lipid metabolism, angiogenesis and inflammation by real-time, quantitative PCR and PCR arrays. WAT morphology and distribution of adipocyte size were analyzed. The level of hypoxia and vascular density was assessed by immunohistochemistry in WAT of young mice.

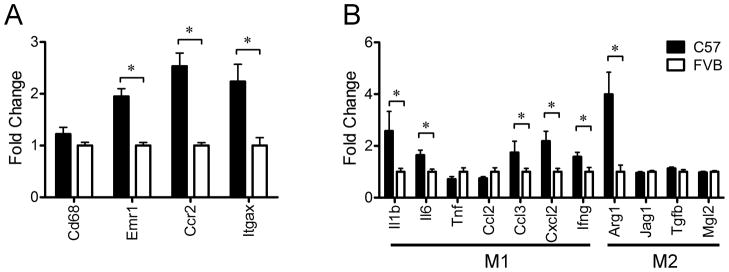
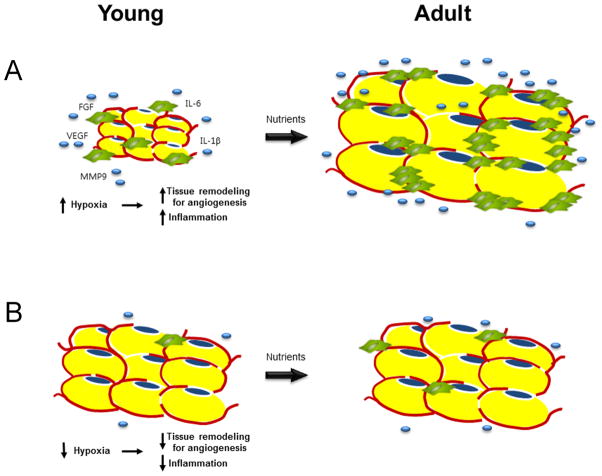
Results: C57Bl/6 mice were DIO and FVB/N (FVB) mice DR after 8 weeks on a low-fat diet or HFD. However, C57Bl/6 mice had lower body weight, lower adiposity, smaller adipocytes and decreased leptin and lipogenic genes expression in adipose tissue than FVB mice at 9 weeks of age on a chow diet. Despite having smaller adipocytes, the level of hypoxia and the expression of pro-angiogenesis genes were higher in WAT of young C57Bl/6 mice than young FVB mice. In addition, expression of genes related to macrophages and their recruitment, and to proinflammatory cytokines, was significantly higher in WAT of young C57Bl/6 mice than young FVB mice.

Conclusion: These data suggest that the potential for WAT remodeling in early period of growth is higher in C57Bl/6 mice as compared with FVB mice, and we hypothesize that it may contribute to the increased susceptibility to DIO of C57Bl/6 mice.


Conflict of interest statement

Conflict of Interest

Dr. Seeley has served as a paid consultant for Novo Nordisk, Eli Lilly, Angiochem, Novartis, and Ethicon Endo-Surgery. Dr. Seeley has served as a paid speaker for Novo Nordisk, Pfizer, and Ethicon Endo-Surgery. Dr. Seeley has received research support from Novo Nordisk, Pfizer, Mannkind, Ablaris and Ethicon Endo-Surgery.

Figures

Figure 1
Figure 1. Changes in body weight, body composition, and energy intake of C57 mice (n=16) and FVB mice (n=16) in response to a LFD or a HFD
A) Change in body weight of C57 and FVB mice after 8 weeks on a LFD or a HFD B) Change in weight gain of C57 and FVB mice after 8 weeks on a LFD or a HFD C) Body composition of C57 and FVB mice after 12 weeks on a LFD or HFD D) Change in cumulative energy intake of C57 and FVB mice after 8 weeks on a LFD or a HFD E) Difference in cumulative energy intake between HFD and LFD in each group * P<0.05. CEI indicates cumulative energy intake.
Figure 2
Figure 2
Differences in body weight (A), body composition (B), mean cross-sectional area (D) and relative distribution of adipocyte size (E), adipose leptin gene expression (F), and differential expression of genes related to lipid metabolism in white adipose tissue (G) between C57 mice (n=8) and FVB mice (n=8) at 9 weeks of age on a chow diet. Representative figures of adipocytes (C) in white adipose tissue of C57 mice and FVB mice at 9 weeks of age on a chow diet. * P<0.05. Acaca, acetyl-CoA carboxylase 1; Adrb3, beta 3-adrenergic receptor; Cd36, fatty acid translocase; Fasn, fatty acid synthase; Lpl, lipoprotein lipase; Ppar2, peroxisome proliferator activated receptor, gamma 2; Srebf, sterol regulatory element binding transcription factor.
Figure 3
Figure 3
Comparison of genes related to angiogenesis in white adipose tissue of C57 mice (n=8) and FVB mice (n=8) at 9 weeks of age on a chow diet. All genes displayed are differentially expressed between C57 mice and FVB mice (P<0.05). Significantly different growth factors (A), transcriptional factors (B), anti-angiogenic factors and matrix metalloproteinases (C), and two pro-angiogenic genes and three anti-angiogenic genes (D). Angpt1, angiopoietin 1; Col4a3, collagen type IV alpha 3 (tumstatin); Ctgf, connective tissue growth factor; Egf, epidermal growth factor; Epas1, endothelial PAS domain protein 1 (Hif-2alpha); Fgf1, fibroblast growth factor 1; Figf, c-fos induced growth factor (VEGF-D); Hgf, hepatocyte growth factor; Flt-1, FMS-like tyrosine kinase 1 (VEGFR-1); Igf1, insulin-like growth factor 1; Lect1, leukocyte cell derived chemotaxin 1; Mmp2, matrix metallopeptidase 2; Mmp9, matrix metallopeptidase 9; Mmp19, matrix metallopeptidase 19; Npr1, natriuretic peptide receptor 1; Pdgfa, platelet derived growth factor alpha; Pgf, placental growth factor; Ptgs1, prostaglandin-endoperoxide synthase 1 (Cox-1); Smad5, MAD homolog 5; Stab1, Stabilin-1; Tbx1, T-box 1; Tbx4, T-box 4; Thbs2, thrombospondin 2; Vegfa, vascular endothelial growth factor A.
Figure 4
Figure 4. Comparison of vessel density and adipose tissue hypoxia in white adipose tissue between C57 mice and FVB mice at 9 weeks of age on a chow diet
A) Difference in vessel density in white adipose tissue of C57 mice (n=5) and FVB mice (n=4) at 9 weeks of age on a chow diet. Vessel density was calculated by dividing total number of vessels per field by total number of adipocytes per field (×40). Arrows indicate CD31 (PECAM1) staining. Scale bar, 100 μm. B) Comparison of genes related to the status of endothelial cells (ECs) in white adipose tissue of C57 mice (n=8) and FVB mice (n=8) at 9 weeks of age on a chow diet. No significant differences in the gene expression were observed between C57 mice (n=8) and FVB mice (n=8). C) Representative figures of adipose tissue hypoxia. Dark brown color indicates the staining area of hypoxia. All samples from C57 mice (n=5) and FVB (n=5) mice were processed in pairs during all the procedures of immunohistochemistry to minimize the occurrence of errors. Hypoxic area was adjusted for either adipocyte number or size in the same field. Scale bar, 100 μm. * P<0.05. Cdh5, cadherin 5; Efna1, ephrin A1; Efnb2, ephrin B2; Ephb4, Eph receptor B4; Pecam1, platelet/endothelial cell adhesion molecule 1; Itgav, integrin alpha V; Itgb3, integrin beta 3.
Figure 5
Figure 5. Differential expression of genes related to inflammation in white adipose tissue of C57 mice (n=8) and FVB mice (n=8) at 9 weeks of age on a chow diet. * P<0.05
A) The expression of genes of markers for macrophage and recruitment of macrophage B) Different polarization of macrophage in white adipose tissue of C57 mice and FVB mice. M1 and M2 mean the type of macrophage polarization. M1-type macrophages are more involved in pro-inflammation and recruitment of macrophage. M2-type macrophages are involved in tissue remodeling. * P<0.05. Arg1, arginase; Ccl2, chemokine (C-C motif) ligand 2; Ccl3, chemokine (C-C motif) ligand 3; Ccr2, chemokine (C-C motif) receptor 2; Cxcl2, chemokine (C-X-C motif) ligand 2; Cd68, CD68 antigen; Emr1, egf-like module containing, mucin-like, hormone receptor-like 1; Ifng, interferon gamma; Il1b, interleukin 1, beta; Il6, interleukin-6; Itgax, integrin, alpha X (complement component 3 receptor 4 subunit); Jag1, jagged 1; Mgl2, macrophage galactose N-acetyl-galactosamine specific lectin 2; Tgfb, transforming growth factor, beta 1; Tnf, tumor necrosis factor
Figure 6
Figure 6. “Potential” hypothesis of increased inflammation and pro-angiogenesis presumably caused by adipose tissue hypoxia despite smaller adipocytes and lower adiposity in young mice
A) The increase in capacity for tissue remodeling resulting from hypoxia may determine the development of obesity in the future. Reduced vascular function responding to dynamic change of nutrients or gas exchange surrounding adipocytes may result in increased hypoxia and subsequent pro-angiogenesis in white adipose tissue despite smaller adipocytes. Inflammation is accompanied by angiogenesis. B) The adequate ability of vasculature to meet the requirements may cause resistance to obesity. Reactivity of vasculature responding to the environments may be enough to compensate for the rapid increase of need for supplying nutrients or gas exchange. Therefore, adipocytes do not need the tissue remodeling for angiogenesis.

References

    1. Kozak LP. Brown fat and the myth of diet-induced thermogenesis. Cell Metab. 2010;11 (4):263–7. - PMC - PubMed
    1. Levin BE. Developmental gene x environment interactions affecting systems regulating energy homeostasis and obesity. Front Neuroendocrinol. 2010;31(3):270–83. - PMC - PubMed
    1. Fukumura D, Ushiyama A, Duda DG, Xu L, Tam J, Krishna V, et al. Paracrine regulation of angiogenesis and adipocyte differentiation during in vivo adipogenesis. Circ Res. 2003;93 (9):e88–97. - PMC - PubMed
    1. Rupnick MA, Panigrahy D, Zhang CY, Dallabrida SM, Lowell BB, Langer R, et al. Adipose tissue mass can be regulated through the vasculature. Proc Natl Acad Sci U S A. 2002;99(16):10730–5. - PMC - PubMed
    1. Crandall DL, Hausman GJ, Kral JG. A review of the microcirculation of adipose tissue: anatomic, metabolic, and angiogenic perspectives. Microcirculation. 1997;4(2):211–32. - PubMed

Publication types

MeSH terms

Substances