Review
. 2012 Sep;192(1):15-31.
doi: 10.1534/genetics.112.140178.

Weak selection and protein evolution

Affiliations
Review

Weak selection and protein evolution

Hiroshi Akashi et al. Genetics. 2012 Sep.

Abstract

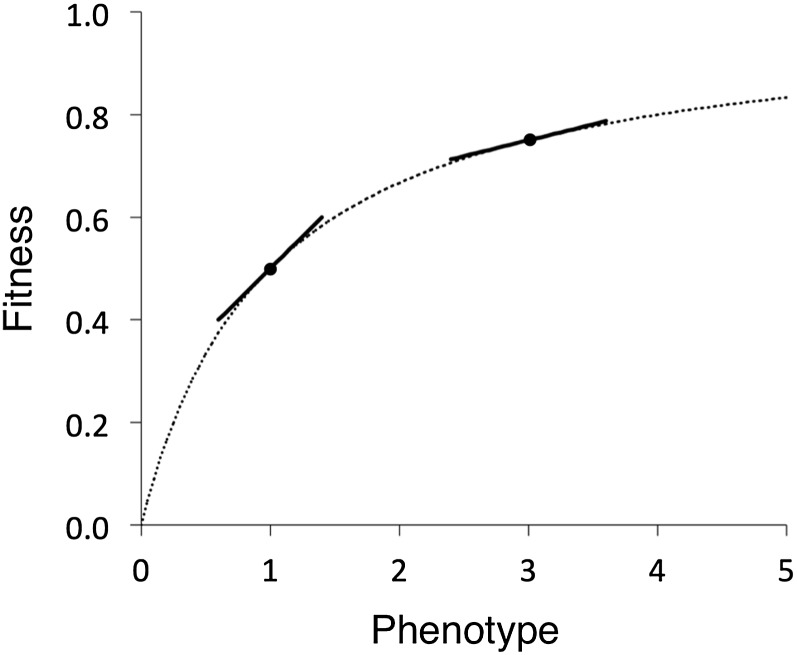
The "nearly neutral" theory of molecular evolution proposes that many features of genomes arise from the interaction of three weak evolutionary forces: mutation, genetic drift, and natural selection acting at its limit of efficacy. Such forces generally have little impact on allele frequencies within populations from generation to generation but can have substantial effects on long-term evolution. The evolutionary dynamics of weakly selected mutations are highly sensitive to population size, and near neutrality was initially proposed as an adjustment to the neutral theory to account for general patterns in available protein and DNA variation data. Here, we review the motivation for the nearly neutral theory, discuss the structure of the model and its predictions, and evaluate current empirical support for interactions among weak evolutionary forces in protein evolution. Near neutrality may be a prevalent mode of evolution across a range of functional categories of mutations and taxa. However, multiple evolutionary mechanisms (including adaptive evolution, linked selection, changes in fitness-effect distributions, and weak selection) can often explain the same patterns of genome variation. Strong parameter sensitivity remains a limitation of the nearly neutral model, and we discuss concave fitness functions as a plausible underlying basis for weak selection.


Figures

Figure 1
Figure 1
Polymorphism and divergence under weak selection. Expected levels of nucleotide diversity and DNA divergence (each relative to neutral mutations) are shown. The dotted line represents nucleotide diversity (probability of observing a polymorphism at a given nucleotide site in a pair of randomly chosen chromosomes) and is calculated using sampling formulas from Sawyer and Hartl (1992), assuming an infinite-sites mutation model and constant Ne. The solid line shows the fixation probabilities of mutations (Kimura 1962). The plots assume directional (genic) selection with fitness values 1, 1 + 1/2s, and 1 + s for the homozygote for the ancestral allele, heterozygote, and homozygote for a new mutation, respectively. The plots assume independent evolution among sites and are based on Kimura (1983, p. 44).
Figure 2
Figure 2
Example evolutionary patterns under slightly deleterious mutations. (A) A probability density function for negative selection coefficients (gamma distribution with shape parameter 0.2 and scale parameter 0.05). The area under the curve gives the proportion of mutations in a given fitness range. This distribution of s was chosen to allow substantial increases in the effectively neutral proportion for population sizes in the range 102–108 and is assumed in plots in B, C, and D. Under this distribution of selective effects (DSEs), <25% of newly arising mutations have s < −0.01 and <2% of mutations have s < −0.1. (B) Cumulative distribution function for selective effects of new mutations. y-axis values are the total areas under the curve in A for x < s < 0. fn, the proportion of “effectively neutral” mutations, −1 < Nes ≤ 0, for a given population size is the y-axis value at x = 1/Ne (values are marked for Ne of 102, 104, 106, 108). (C) Cumulative distribution function for Nes. y-axis values are the areas under the DSE curve for x < Nes < 0 in A. Curves are shown for Ne of 102, 104, 106, and 108 (thicker lines represent larger population sizes). fn values are indicated (as solid circles) for each population size. (D) Polymorphism and divergence as a function of Ne. Expected DNA diversity (πN/πS, dotted line) and divergence (dN/dS, solid line) are shown. The dashed line shows fn, and values for Ne of 102, 104, 106, and 108 are marked. Expected divergence is smaller than fn because selection reduces fixation rates for slightly deleterious mutations within this range. πN/πS values are higher than fn because mutations in the range Nes < −1 contribute to polymorphism (Figure 1). These plots assume independent evolution among sites.
Figure 3
Figure 3
Example evolutionary patterns for slightly deleterious and advantageous mutations. (A) Probability density function for positive selection coefficients (gamma distribution with shape parameter 1 and scale parameter 5 × 10⁻⁷). (B) Cumulative distribution function for selective effects of new mutations. y-Axis values are the total areas under the curve for 0 < s < x in A. fn for a given population size is the y-axis value at x = 1/Ne (values are marked for Ne of 104, 106, 108). Almost all beneficial mutations are effectively neutral in Ne of 102 and 104, and almost none are effectively neutral in Ne of 108. (C) Cumulative distribution function for Nes or scaled selective effects. y-Axis values are the areas under the DSE curve for 0 < Nes < x in A. Curves are shown for Ne values of 102, 104, 106, and 108 (thicker lines represent larger population sizes). fn values are shown as solid circles for each population size. (D) Polymorphism and divergence as a function of Ne for a distribution of fitness effects that combines the density functions in Figure 2A (99% of new mutations) and Figure 3A (1% of new mutations). The dashed line shows the proportion of advantageous fixations. Expected DNA diversity (πN/πS, dotted line) and divergence (dN/dS, solid line) are shown. These predictions assume independent evolution among sites.
Figure 4
Figure 4
Levels of nonsynonymous and synonymous DNA polymorphism among populations. DNA diversity for nonsynonymous mutations (scaled to DNA diversity for synonymous mutations) is plotted against DNA diversity for synonymous mutations (an estimate of population size). πS is a proxy for population size if mutation rates are similar among the species compared. Note that statistical analyses of such data must account for the contribution of πS to both axes (Piganeau and Eyre-Walker 2009; Elyashiv et al. 2010). Common symbols in each plot indicate the same set of genes compared among species. Data are shown for taxa for which six or more independent populations have been sampled for ≥20 nuclear genes. See Table S1 for species names, sample numbers, number of loci, and references (as well as data for a more limited number of Drosophila species).
Figure 5
Figure 5
Concave fitness functions and near neutrality. The curve y = x/(1 + x) shows a hypothetical relationship between fitness and phenotypic values of a trait. The slope of the curve at a given point determines the fitness effect of small phenotypic changes (slopes are shown for phenotypic values of 1 and 3). The slope decreases as a function of the phenotypic value (i.e., the distribution of s changes with character values). If a large fraction of mutations have small phenotypic effects and if the rate of mutation to deleterious alleles is higher than the rate to advantageous mutations, populations will evolve to a point on the curve where slightly deleterious mutations that move the population away from the optimum will be balanced by weak positive selection. The left and right points marked in the figure correspond to equilibrium points in species with small and large population sizes, respectively (this assumes constant mutation rates and population sizes).

References

    1. Abbot P., Moran N. A., 2002. Extremely low levels of genetic polymorphism in endosymbionts (Buchnera) of aphids (Pemphigus). Mol. Ecol. 11: 2649–2660 - PubMed
    1. Agrawal A. F., Whitlock M. C., 2011. Inferences about the distribution of dominance drawn from yeast gene knockout data. Genetics 187: 553–566 - PMC - PubMed
    1. Akashi H., 1995. Inferring weak selection from patterns of polymorphism and divergence at “silent” sites in Drosophila DNA. Genetics 139: 1067–1076 - PMC - PubMed
    1. Akashi H., 1996. Molecular evolution between Drosophila melanogaster and D. simulans: reduced codon bias, faster rates of amino acid substitution, and larger proteins in D. melanogaster. Genetics 144: 1297–1307 - PMC - PubMed
    1. Akashi H., 1999a. Inferring the fitness effects of DNA mutations from polymorphism and divergence data: statistical power to detect directional selection under stationarity and free recombination. Genetics 151: 221–238 - PMC - PubMed