Review
. 2012 Sep;192(1):73-105.
doi: 10.1534/genetics.111.135731.

Nutritional control of growth and development in yeast

Affiliations
Review

Nutritional control of growth and development in yeast

James R Broach. Genetics. 2012 Sep.

Abstract

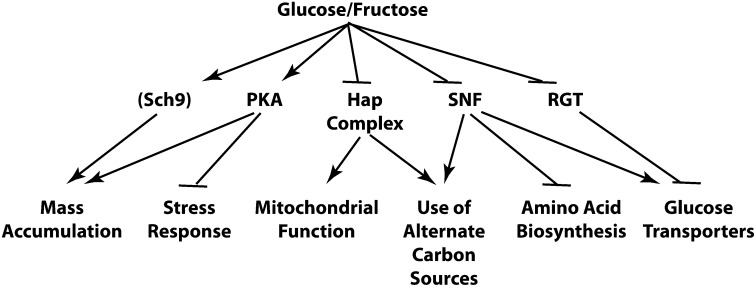
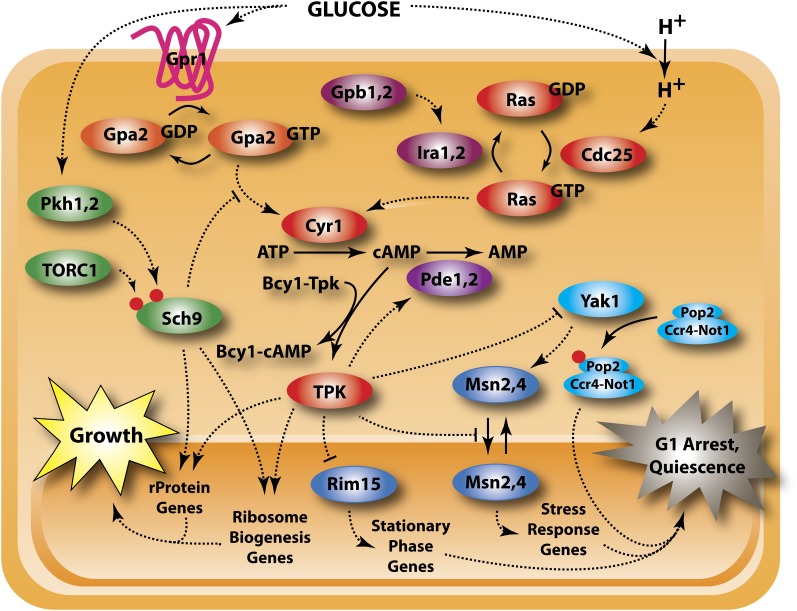
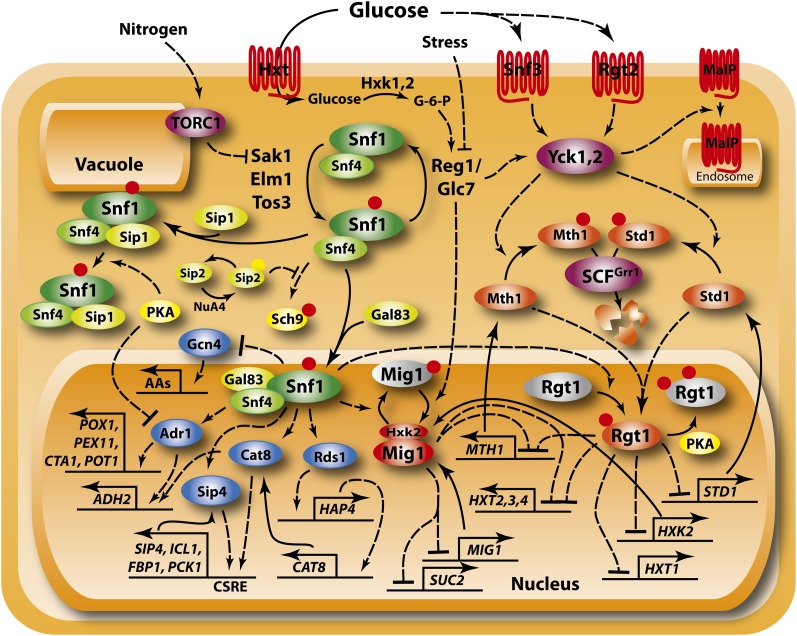
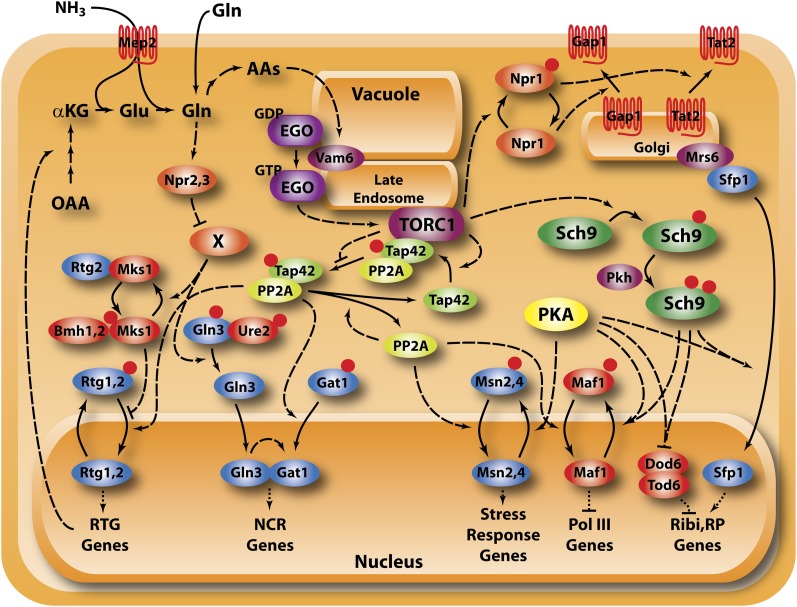
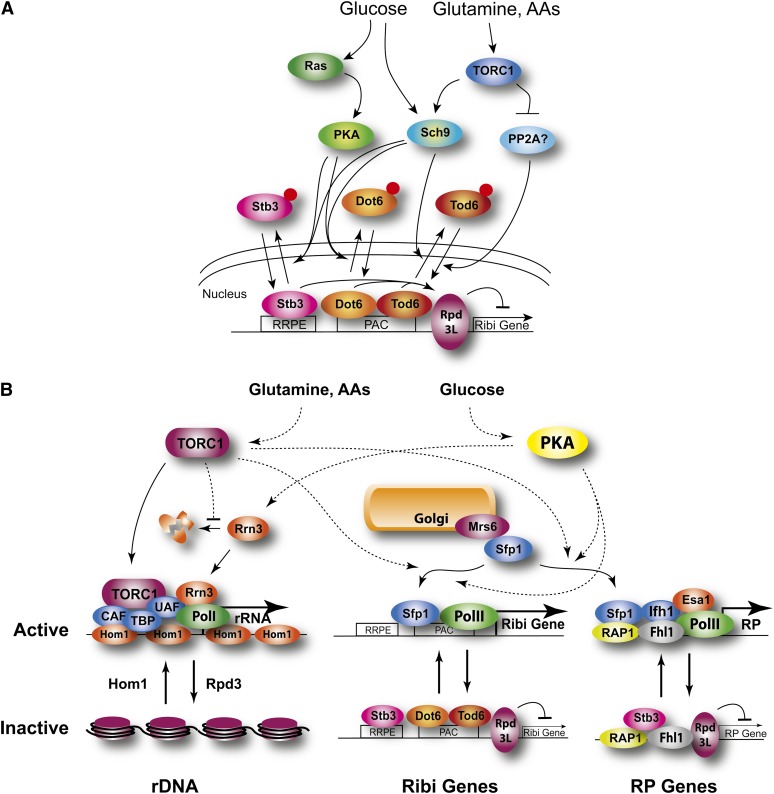
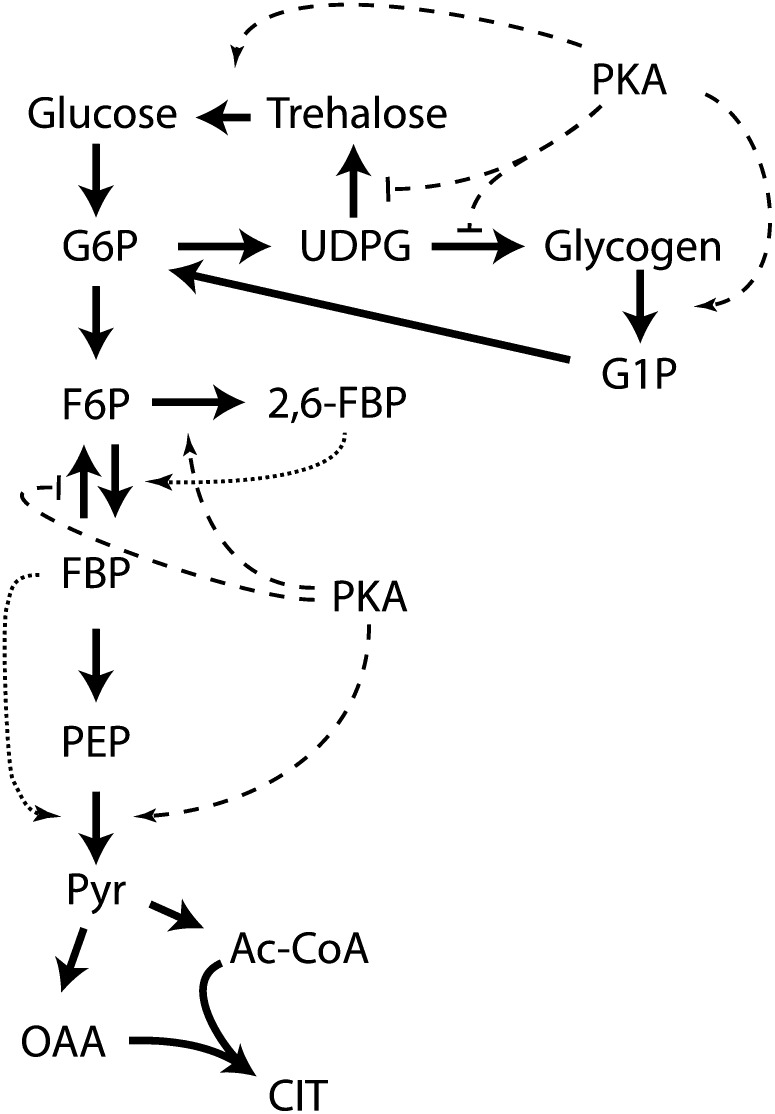
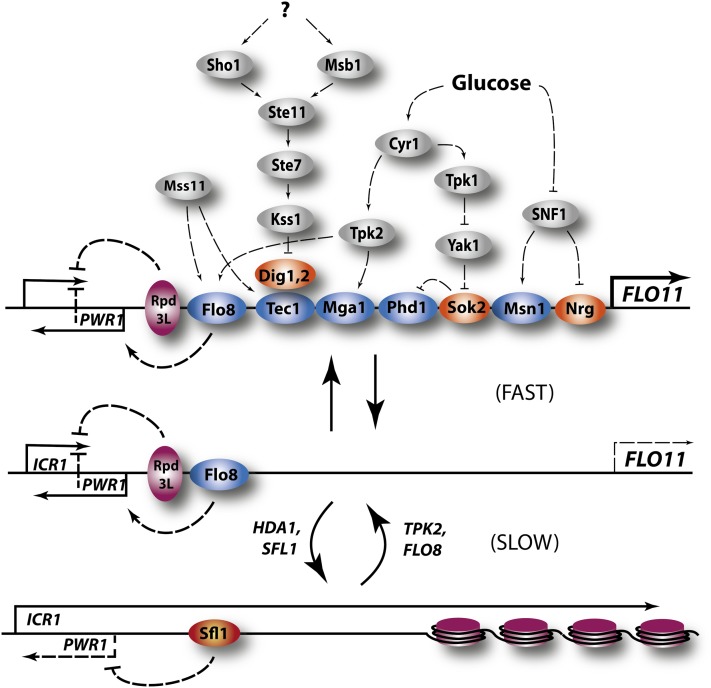
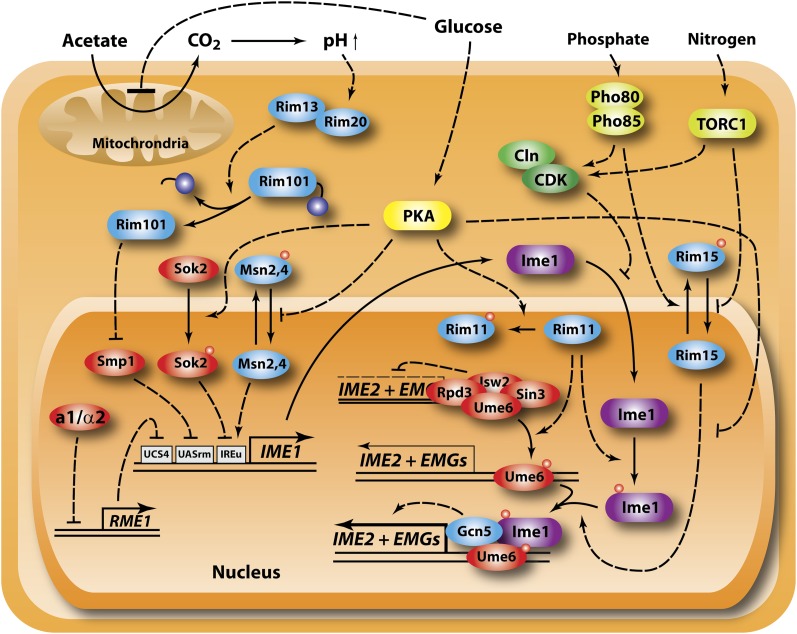
Availability of key nutrients, such as sugars, amino acids, and nitrogen compounds, dictates the developmental programs and the growth rates of yeast cells. A number of overlapping signaling networks--those centered on Ras/protein kinase A, AMP-activated kinase, and target of rapamycin complex I, for instance--inform cells on nutrient availability and influence the cells' transcriptional, translational, posttranslational, and metabolic profiles as well as their developmental decisions. Here I review our current understanding of the structures of the networks responsible for assessing the quantity and quality of carbon and nitrogen sources. I review how these signaling pathways impinge on transcriptional, metabolic, and developmental programs to optimize survival of cells under different environmental conditions. I highlight the profound knowledge we have gained on the structure of these signaling networks but also emphasize the limits of our current understanding of the dynamics of these signaling networks. Moreover, the conservation of these pathways has allowed us to extrapolate our finding with yeast to address issues of lifespan, cancer metabolism, and growth control in more complex organisms.


Figures

Figure 1
Figure 1
An overview of glucose signaling pathways. Different signaling networks respond to availability of fermentable sugars and regulate distinct, albeit overlapping, functions that optimize growth under the particular nutrient status of the cell. Sch9 appears to respond directly to sugar availability but the mechanistic connection is not well defined.
Figure 2
Figure 2
The Ras/PKA and Gpa2 pathways. The Ras/PKA pathway plays a central role in regulating growth vs. quiescence in response to the quality and quantity of the available carbon source, primarily by stimulating mass accumulation and inhibiting the stress response. The major input proceeds through Ras, likely in response to glucose-stimulated intracellular acidification, with minor input through the G-protein coupled receptor, Gpr1. Sch9 also mediates the cell growth response to glucose but the indicated link is only speculative. Red dots signify phosphorylation.
Figure 3
Figure 3
The Snf1 and Rgt pathways. The Snf1 (green and yellow icons) and Rgt (purple and orange icons) are interlocking pathways that regulate use of alternate carbon sources, primarily through regulation of a constellation of transcriptional activators (blue icons) and repressors (red and orange icons). Rgt1 responds to glucose levels through two membrane glucose sensors. Snf1 responds primarily to glucose through modulation of the Reg1/Glc7 protein phosphatase 1 (PP1), although stress and nitrogen levels also impinge on Snf1 activity through distinct routes. Snf1 also represses amino acid biosynthetic genes (AAs) through inhibition of Gcn4 translation. The Snf1/Snf4 holoenzyme acquires substrate specificity through interaction with one of three distinct β subunits, Gal83, Sip1, or Sip2. Acetylation (yellow dot) of Sip2, catalyzed by NuA4 and reversed by Rpd3, stimulates associated between Sip2 and Snf1, an interaction that blocks activation of Sch9. Finally, PP1 stimulates internalization of the maltose permease (MalP) in response to glucose through the action of yeast casein kinases 1 and 2 (Yck1,2).
Figure 4
Figure 4
TORC1 and nitrogen regulation. Two pathways, one mediated by TORC1 and a second less well-defined nitrogen catabolite repression pathway, adjust growth as well as expression of genes required for use of alternate nitrogen sources in response to the quality and quantity of available nitrogen sources through regulation of transcriptional activators (blue icons) and repressors (red icons). TORC1 likely responds to intracellular amino acid levels sensed through the Ego complex and regulates growth primarily through Sch9, regulates stress, and alternative nitrogen source through protein phosphatase 2A and regulates permease sorting through Npr1. Npr2/3 lie upstream of NCR gene expression but whether they regulate TORC1 or the ill-defined NCR pathway is not clear.
Figure 5
Figure 5
Regulation of ribosome biogenesis. (A) Ribi gene repressors. Ribi gene expression responds to nutritional input through alleviation of repression effected by Dot1, Tod1, and Stb3, which recruit the histone deacetylase Rpd3L. Expression requires inactivation of all three repressors and, while input exhibits significant cross-talk, glucose and Ras/PKA predominantly influence Dot1 activity while nitrogen and TORC1 predominantly influence Tod6 activity. (B) rDNA, RP, and Ribi gene regulation. Regulation of rRNA transcription by nutrients involves both template activation—from a repressed, nucleosome-bound state to a locus bound predominantly by the high-mobility group protein Hmo1—as well as regulation of Pol I initiation, primarily controlled by the level and interaction of Rrn3 with Pol I. Transcriptional regulation of Ribi and ribosomal protein (RP) genes involves both local reorganization of the promoters as well as translocation of the split finger transcription factor from a cytoplasmic association with Mrs6 to the nucleus, where it peripherally associates with the promoters.
Figure 6
Figure 6
Allosteric regulation of carbon metabolism. Metabolite-mediated allosteric interactions and PKA-catalyzed phosphorylations regulating metabolic flux in carbon utilization are shown in an abbreviated version of the glycolytic/gluconeogenic and storage carbohydrate pathways.
Figure 7
Figure 7
Nutrient regulation of Flo11 expression. The large FLO11 promoter exists in three states: epigenetically silenced (lower), permissive for activation (middle), and activated (upper). Transition between the silenced and permissive state occurs slowly and is associated with the alternative binding of the Sfl1 repressor and the Flo8 activator, which regulate expression of two upstream noncoding RNAs, the antisense PWR1 transcript and the sense ICR1 transcript. Extended transcription of ICR1 interferes with activation from the FLO11 promoter, associated with nucleosome-mediated occlusion of the transcriptional start site. In the permissive state, in which PWR1 expression blocks extension of ICR1 into the promoter, various activators (blue) and repressors (red) modulate expression of the gene in response to environmental conditions via various signaling networks (gray).
Figure 8
Figure 8
Nutrient regulation of meiosis. Nutrients control entry into meiosis through regulation of IME1 transcription (left) and Ime1 function (right) in induction of IME2 and a number of early meiotic genes (EMGs). Alkaline pH resulting from oxidation of acetate activates Rim101 by proteolytic cleavage to inactivate the IME1 repressor, Smp1. Absence of glucose reduces PKA activity, leading to inactivation of the Sok2 repressor and activation of the Msn2,4 transcriptional activators. The absence of PKA also permits activation of the Rim11 and Rim15 kinases, which influence Ime1 function. Phosphate or nitrogen deprivation reduces cyclin dependent kinase (CDK) activity, permitting entry of new translated Ime1 into the nucleus. Nitrogen and phosphate, through TORC1 and Pho80/Pho85 kinases, respectively, affect access of the Rim15 kinase to the nucleus.

References

    1. Ahuatzi D., Herrero P., de la Cera T., Moreno F., 2004. The glucose-regulated nuclear localization of hexokinase 2 in Saccharomyces cerevisiae is Mig1-dependent. J. Biol. Chem. 279: 14440–14446 - PubMed
    1. Ahuatzi D., Riera A., Pelaez R., Herrero P., Moreno F., 2007. Hxk2 regulates the phosphorylation state of Mig1 and therefore its nucleocytoplasmic distribution. J. Biol. Chem. 282: 4485–4493 - PubMed
    1. Aragon A. D., Quinones G. A., Thomas E. V., Roy S., Werner-Washburne M., 2006. Release of extraction-resistant mRNA in stationary phase Saccharomyces cerevisiae produces a massive increase in transcript abundance in response to stress. Genome Biol. 7: R9. - PMC - PubMed
    1. Arribere J. A., Doudna J. A., Gilbert W. V., 2011. Reconsidering movement of eukaryotic mRNAs between polysomes and P bodies. Mol. Cell 44: 745–758 - PMC - PubMed
    1. Ashrafi K., Lin S. S., Manchester J. K., Gordon J. I., 2000. Sip2p and its partner snf1p kinase affect aging in S. cerevisiae. Genes Dev. 14: 1872–1885 - PMC - PubMed

Publication types