. 2013 Jan;23(1):60-73.
doi: 10.1101/gr.142661.112. Epub 2012 Sep 10.

Modeling of epigenome dynamics identifies transcription factors that mediate Polycomb targeting

Affiliations

Modeling of epigenome dynamics identifies transcription factors that mediate Polycomb targeting

Phil Arnold et al. Genome Res. 2013 Jan.

Abstract

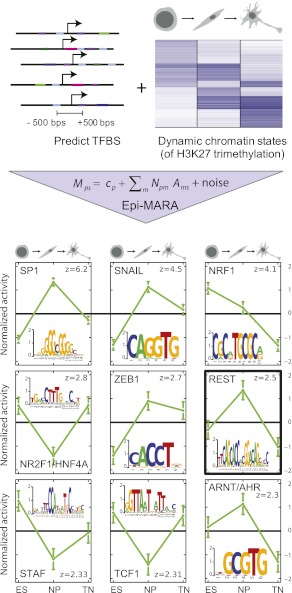
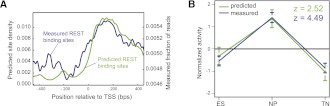
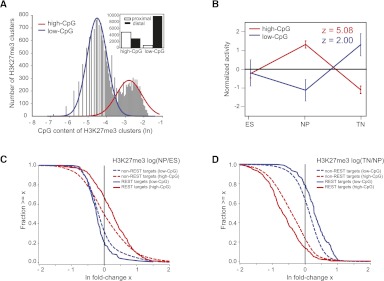
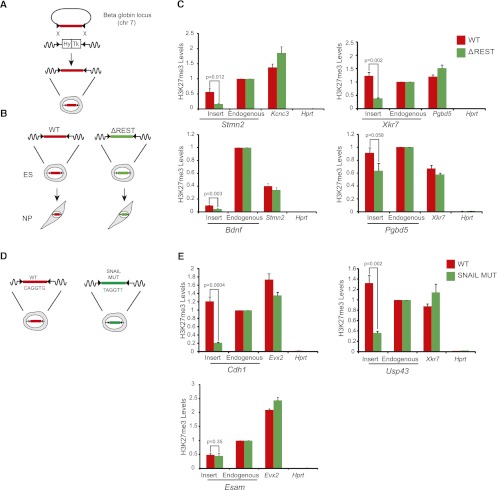
Although changes in chromatin are integral to transcriptional reprogramming during cellular differentiation, it is currently unclear how chromatin modifications are targeted to specific loci. To systematically identify transcription factors (TFs) that can direct chromatin changes during cell fate decisions, we model the relationship between genome-wide dynamics of chromatin marks and the local occurrence of computationally predicted TF binding sites. By applying this computational approach to a time course of Polycomb-mediated H3K27me3 marks during neuronal differentiation of murine stem cells, we identify several motifs that likely regulate the dynamics of this chromatin mark. Among these, the sites bound by REST and by the SNAIL family of TFs are predicted to transiently recruit H3K27me3 in neuronal progenitors. We validate these predictions experimentally and show that absence of REST indeed causes loss of H3K27me3 at target promoters in trans, specifically at the neuronal progenitor state. Moreover, using targeted transgenic insertion, we show that promoter fragments containing REST or SNAIL binding sites are sufficient to recruit H3K27me3 in cis, while deletion of these sites results in loss of H3K27me3. These findings illustrate that the occurrence of TF binding sites can determine chromatin dynamics. Local determination of Polycomb activity by REST and SNAIL motifs exemplifies such TF based regulation of chromatin. Furthermore, our results show that key TFs can be identified ab initio through computational modeling of epigenome data sets using a modeling approach that we make readily accessible.


Figures

Figure 1.
Figure 1.
Epi-MARA's approach to predicting transcription factor activities that explain dynamics in H3K27me3 levels during neuronal differentiation. Transcription factor binding sites were predicted in proximal promoters genome-wide, using a Bayesian method that explicitly models binding site evolution. Epi-MARA models measured chromatin dynamics in terms of predicted TFBSs. Mps quantifies the amount of a particular epigenetic mark M at promoter p in sample s, Npm denotes the total number of predicted binding sites for regulatory motif m in promoter p, cp indicates the basal level of the mark at promoter p, and Ams is the unknown activity of motif m in sample s, which is inferred by the method. Depicted are the normalized activity profiles of the top nine motifs (green lines, with standard errors indicated) with their respective z-values. The three time points correspond to the embryonic stem cell (ES), neuronal progenitor (NP), and terminal neuron (TN) stage. (Insets) Sequence logos of each of the motifs and the transcription factors thought to bind to them are shown.
Figure 2.
Figure 2.
Analysis of REST binding data supports computational predictions. (A) Frequency of predicted (green line) and measured (blue line) binding sites around TSSs. (B) REST activity profiles calculated by Epi-MARA are similar when using either computationally predicted (green line) or measured REST binding sites (blue line). The prediction has higher significance when using the measured sites as indicated by the higher z-value (i.e., higher variance in activity relative to the error bars).
Figure 3.
Figure 3.
REST is associated with H3K27me3 dynamics at high- and low-CpG regions genome-wide. (A) The distribution of CpG dinucleotide frequencies of H3K27me3 regions genome-wide is bimodal and can be fit by a mixture of two log-normal distributions (red and blue lines) corresponding to high- and low-CpG regions, respectively. (Inset) Numbers of K27me3 regions that are promoter-proximal and distal for high-CpG and low-CpG regions. (B) REST activity profiles on high- (red) and low-CpG regions (blue) as inferred by running Epi-MARA on all H3K27me3 regions genome-wide show a transient gain and loss, respectively, at the NP stage. Note that, whereas REST activity on the high-CpG regions is highly significant, on the low-CpG regions REST activity has a much weaker significance. (C) Reverse cumulative distributions of changes in H3K27me3 levels at the transition from ES to NP stage. We divided regions that were enriched for H3K27me3 into high-CpG/low-CpG (red/blue) and REST-target/nontarget (solid/broken lines) regions. At high-CpG regions REST targets tend to gain H3K27me3 going from the ES to the NP stage whereas nontarget regions are equally likely to gain or lose H3K27me3. In contrast, most low-CpG regions lose H3K27me3 going to the NP stage, and REST targets tend to lose even more H3K27me3. (D) As in panel C but now for the transition from the NP to the TN stage. High-CpG regions generally tend to lose H3K27me3 and REST targets tend to lose even more, whereas low-CpG regions tend to gain H3K27me3 and REST targets tend to gain even more.
Figure 4.
Figure 4.
REST is required for H3K27me3 dynamics in NP cells. (A) ChIP-Seq signal for H3K27me3 and REST in representative genomic regions. Shown are H3K27me3 signal in ES cells, NPs of wild-type (WT) and RESTko cells, as well as REST signal in NPs. The top panel exemplifies selective loss of H3K27me3 at the REST binding site of the Xkr7 locus, whereas neighboring regions (BC020535) remain unaffected. The lower panel shows similar loss of H3K27me3 at the Stmn2 locus. Both the Xkr7 and Stmn2 loci are examples of promoter-proximal high-CpG regions. Shown are normalized read densities. The red bars at the REST peaks indicate the regions cloned for transgenic experiments. (B) Global comparison of H3K27me3 levels between wild-type and RESTko cells. Shown are the normalized distributions (see Methods) of the ratio between H3K27me3 in wild type versus RESTko for nontarget regions (black lines) and for either low-CpG (blue lines) or high-CpG (red lines) regions that are REST targets at the ES (left panel) and NP (right panel) stage. (Insets) Estimated fractions of REST targets that significantly lose or gain H3K27me3 in the RESTko at high-CpG (red) and low-CpG regions (blue). There are few significantly changing targets at the ES stage. At the NP stage a significant fraction of high-CpG targets lose H3K27me3 and a smaller but still significant fraction of low-CpG targets gain H3K27me3 in the RESTko cells.
Figure 5.
Figure 5.
TFBS are required for H3K27me3 recruitment at the NP stage. (A) Strategy to insert promoter regions into a defined genetic site (beta globin locus) via RMCE. The two marker genes inserted into the beta globin locus confer resistance against hygromycin (Hy) and sensitivity against ganciclovir (Tk), respectively, and are flanked by two inverted lox sites (black triangles). Targeted insertion of a given transgene is achieved by Cre-mediated recombination and negative selection. (B) The RMCE approach was used to insert several REST target promoter fragments with either wild-type sequence (WT) or REST site mutation (ΔREST) into the beta globin locus. Correctly targeted ES cells were differentiated to the NP stage, where H3K27me3 and REST were measured at the inserted fragments. (C) For each of the four inserts H3K27me3 levels were measured in cells bearing the WT fragment (red bars) and in cells bearing the ΔREST fragment (green bars). Levels were measured at, from left to right in each panel, the inserted region, the corresponding endogenous locus, a positive control, and a negative control region. Note that different promoter regions are used as positive controls in the different panels. All inserted WT fragments show significant recruitment of H3K27me3 and loss in H3K27me3 for the ΔREST fragments. (D) Either wild-type (WT) or mutated (MUT) promoter regions containing predicted SNAIL sites were inserted via RMCE. The SNAIL sites were mutated by changing the first and last nucleotide of the motif to a Thymidine. Correctly targeted ES cells were differentiated to the NP stage. (E) For each of the three inserts H3K27me3 levels were measured in cells bearing the WT promoter (red bars) and in cells bearing promoters with mutated SNAIL sites (green bars). Note that the Cdh1, Usp43, and Esam promoter regions have three, two, and one predicted/mutated SNAIL site, respectively. Levels were measured at, from left to right in each panel, the inserted region, the corresponding endogenous locus, a positive control, and a negative control region. All H3K27me3 levels are scaled to that of the endogenous region and error bars show the standard error of three biological replicates. A P-value is shown and calculated for each insert using unpaired one-tailed t-test statistics.

Similar articles

Cited by

References

    1. Abbott A 2011. Europe to map the human epigenome. Nature 477: 518 doi: 10.1038/477518a - PubMed
    1. Arnold P, Erb I, Pachkov M, Molina N, van Nimwegen E 2012. MotEvo: Integrated Bayesian probabilistic methods for inferring regulatory sites and motifs on multiple alignments of DNA sequences. Bioinformatics 28: 487–494 - PubMed
    1. Balwierz PJ, Carninci P, Daub CO, Kawai J, Hayashizaki Y, Van Belle W, Beisel C, van Nimwegen E 2009. Methods for analyzing deep sequencing expression data: Constructing the human and mouse promoterome with deepCAGE data. Genome Biol 10: R79 doi: 10.1186/gb-2009-10-7-r79 - PMC - PubMed
    1. Barrera LO, Ren B 2006. The transcriptional regulatory code of eukaryotic cells—insights from genome-wide analysis of chromatin organization and transcription factor binding. Curr Opin Cell Biol 18: 291–298 - PubMed
    1. Beer MA, Tavazoie S 2004. Predicting gene expression from sequence. Cell 117: 185–198 - PubMed

Publication types

MeSH terms

Associated data