

The architecture of eukaryotic translation
- PMID: 22965119
- PMCID: PMC3488257
- DOI: 10.1093/nar/gks825
The architecture of eukaryotic translation
Abstract
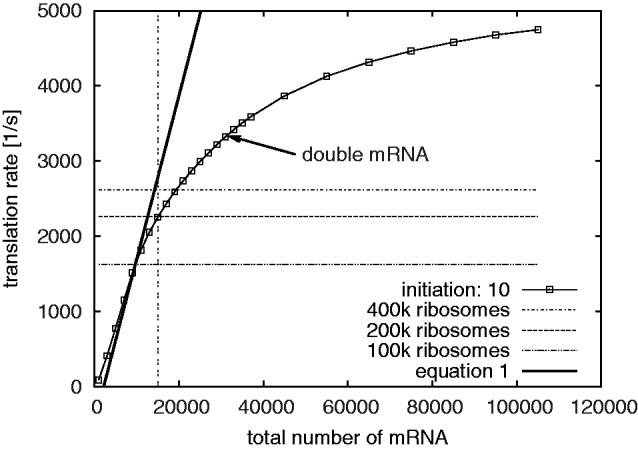
Translation in baker's yeast involves the coordinated interaction of 200,000 ribosomes, 3,000,000 tRNAs and between 15,000 and 60,000 mRNAs. It is currently unknown whether this specific constellation of components has particular relevance for the requirements of the yeast proteome, or whether this is simply a frozen accident. Our study uses a computational simulation model of the genome-wide translational apparatus of yeast to explore quantitatively which combinations of mRNAs, ribosomes and tRNAs can produce viable proteomes. Surprisingly, we find that if we only consider total translational activity over time without regard to composition of the proteome, then there are many and widely differing combinations that can generate equivalent synthesis yields. In contrast, translational activity required for generating specific proteomes can only be achieved within a much more constrained parameter space. Furthermore, we find that strongly ribosome limited regimes are optimal for cells in that they are resource efficient and simplify the dynamics of the system.
Figures
 ).
).
Similar articles
-
The role of tRNA and ribosome competition in coupling the expression of different mRNAs in Saccharomyces cerevisiae.Nucleic Acids Res. 2011 Aug;39(15):6705-14. doi: 10.1093/nar/gkr300. Epub 2011 May 9. Nucleic Acids Res. 2011. PMID: 21558172 Free PMC article.
-
Dissecting eukaryotic translation and its control by ribosome density mapping.Nucleic Acids Res. 2005 Apr 28;33(8):2421-32. doi: 10.1093/nar/gki331. Print 2005. Nucleic Acids Res. 2005. PMID: 15860778 Free PMC article.
-
Protein-protein interactions required during translation.Plant Mol Biol. 2002 Dec;50(6):949-70. doi: 10.1023/a:1021220910664. Plant Mol Biol. 2002. PMID: 12516864 Review.
-
Lso2 is a conserved ribosome-bound protein required for translational recovery in yeast.PLoS Biol. 2018 Sep 12;16(9):e2005903. doi: 10.1371/journal.pbio.2005903. eCollection 2018 Sep. PLoS Biol. 2018. PMID: 30208026 Free PMC article.
-
Baker's yeast, the new work horse in protein synthesis studies: analyzing eukaryotic translation initiation.Bioessays. 1990 Nov;12(11):519-26. doi: 10.1002/bies.950121103. Bioessays. 1990. PMID: 2085318 Review.
Cited by
-
Efficient translation initiation dictates codon usage at gene start.Mol Syst Biol. 2013 Jun 18;9:675. doi: 10.1038/msb.2013.32. Mol Syst Biol. 2013. PMID: 23774758 Free PMC article.
-
Analysis of Translation Elongation Dynamics in the Context of an Escherichia coli Cell.Biophys J. 2016 May 10;110(9):2120-31. doi: 10.1016/j.bpj.2016.04.004. Biophys J. 2016. PMID: 27166819 Free PMC article.
-
The herpes simplex virus 1 virion host shutoff protein enhances translation of viral late mRNAs by preventing mRNA overload.J Virol. 2014 Sep 1;88(17):9624-32. doi: 10.1128/JVI.01350-14. Epub 2014 Jun 11. J Virol. 2014. PMID: 24920814 Free PMC article.
-
RNA G-quadruplexes at upstream open reading frames cause DHX36- and DHX9-dependent translation of human mRNAs.Genome Biol. 2018 Dec 27;19(1):229. doi: 10.1186/s13059-018-1602-2. Genome Biol. 2018. PMID: 30591072 Free PMC article.
-
Hijacked then lost in translation: the plight of the recombinant host cell in membrane protein structural biology projects.Curr Opin Struct Biol. 2015 Jun;32:147-55. doi: 10.1016/j.sbi.2015.04.003. Epub 2015 Jun 1. Curr Opin Struct Biol. 2015. PMID: 26037971 Free PMC article. Review.
References
Publication types
MeSH terms
Substances
LinkOut - more resources
Full Text Sources
Molecular Biology Databases
