

Glioblastoma resistance to anti-VEGF therapy is associated with myeloid cell infiltration, stem cell accumulation, and a mesenchymal phenotype
- PMID: 22965162
- PMCID: PMC3480262
- DOI: 10.1093/neuonc/nos158
Glioblastoma resistance to anti-VEGF therapy is associated with myeloid cell infiltration, stem cell accumulation, and a mesenchymal phenotype
Abstract
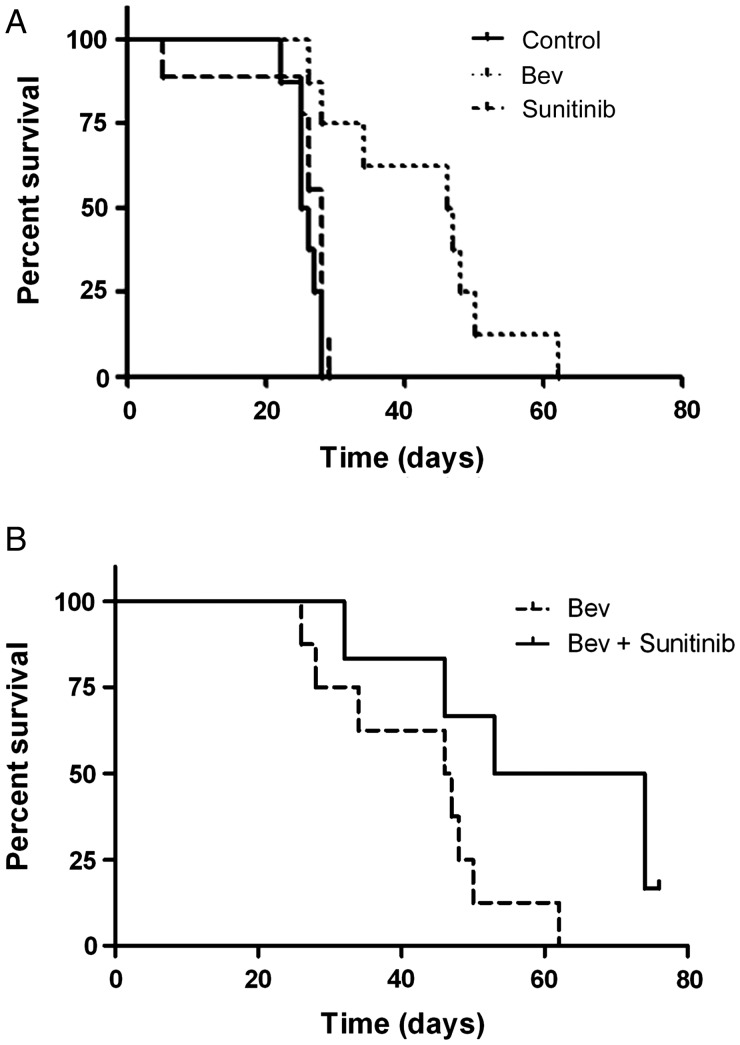
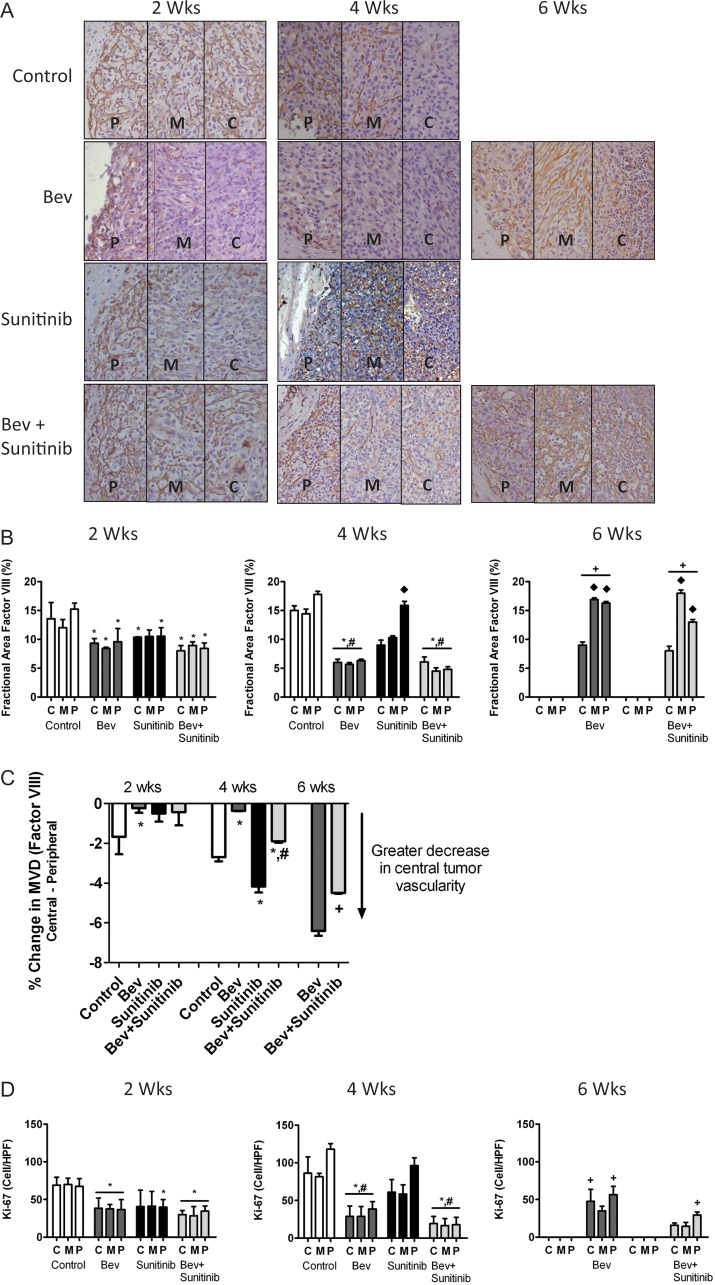
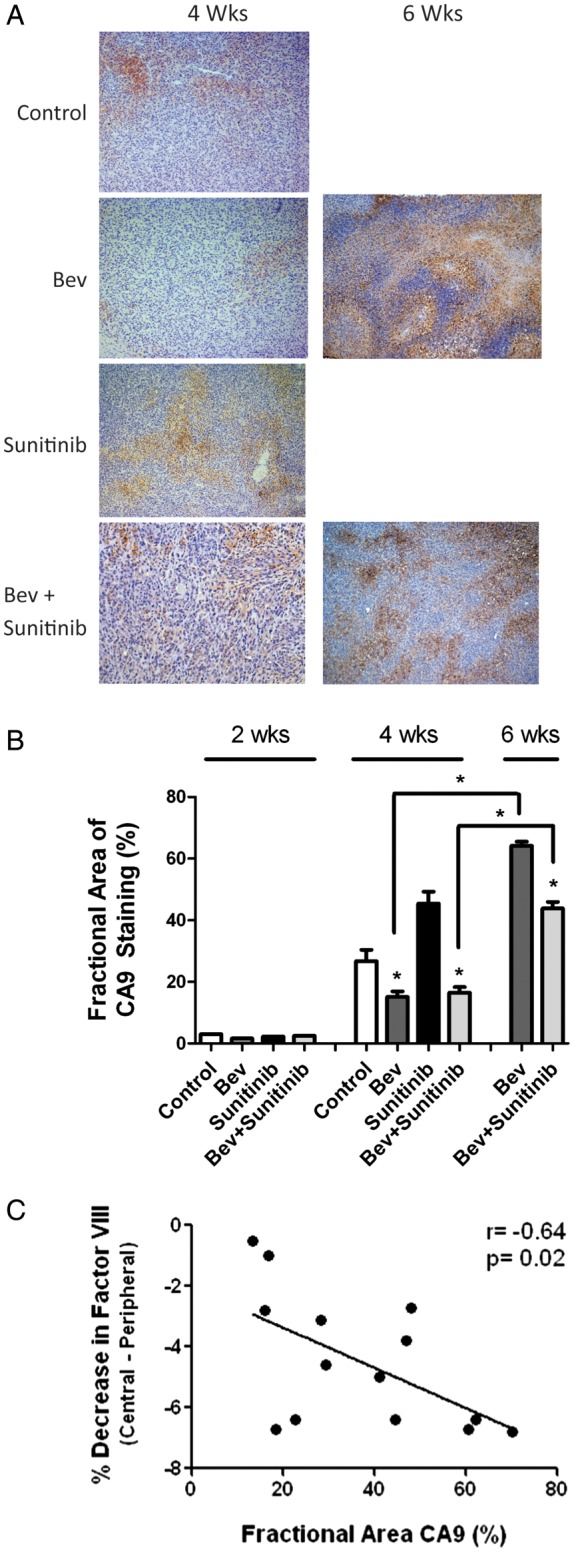
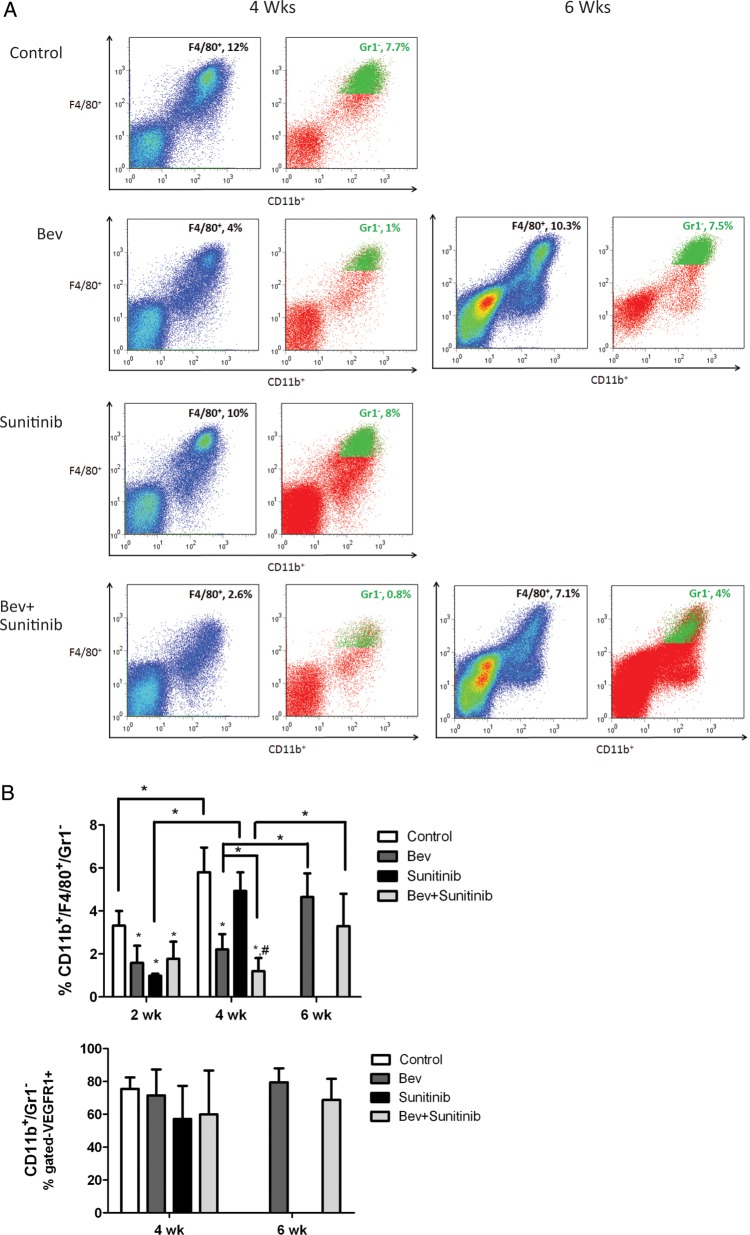
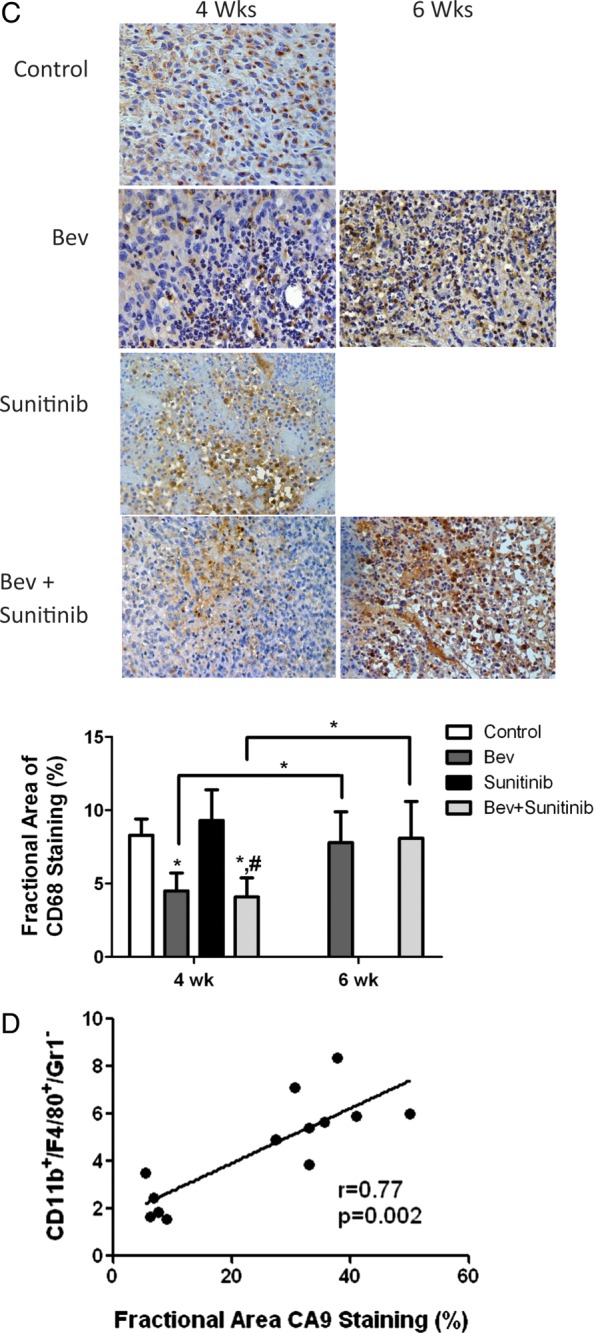
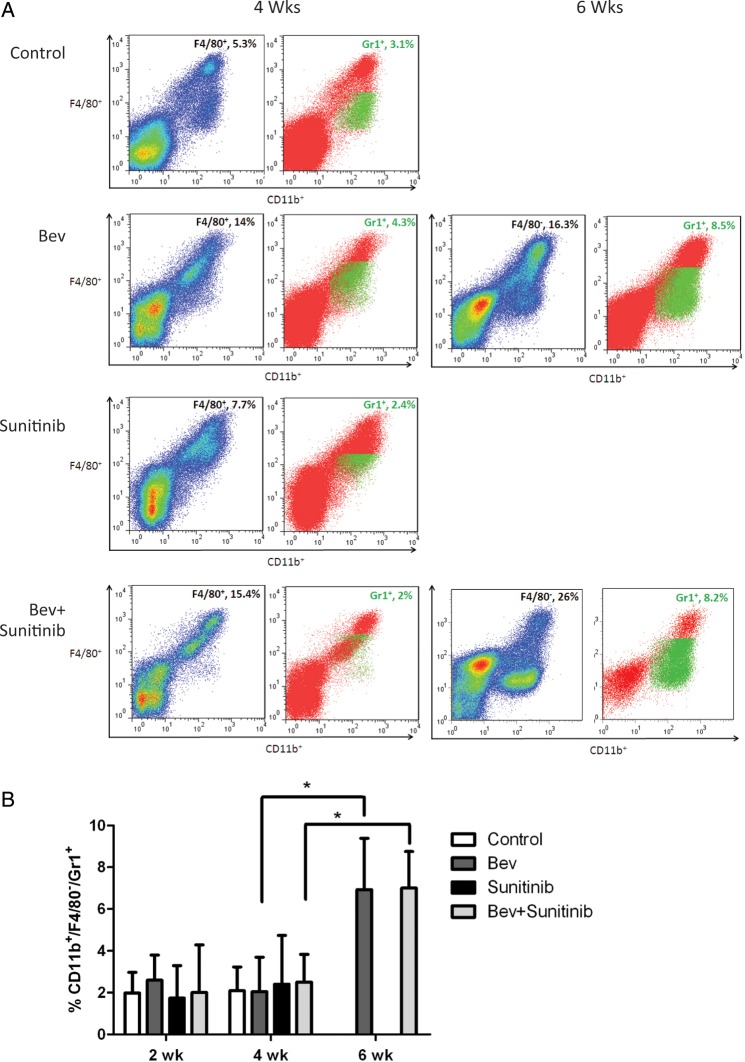
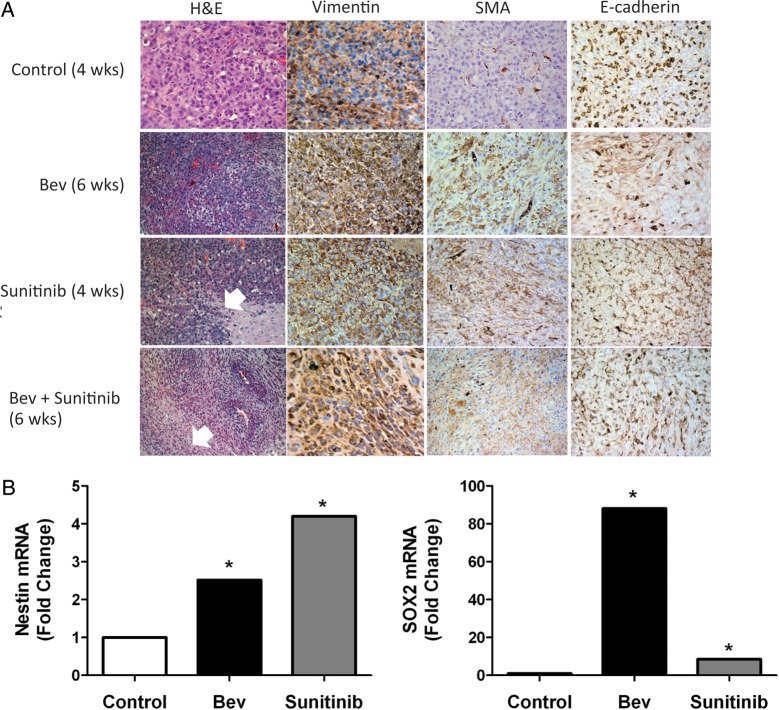
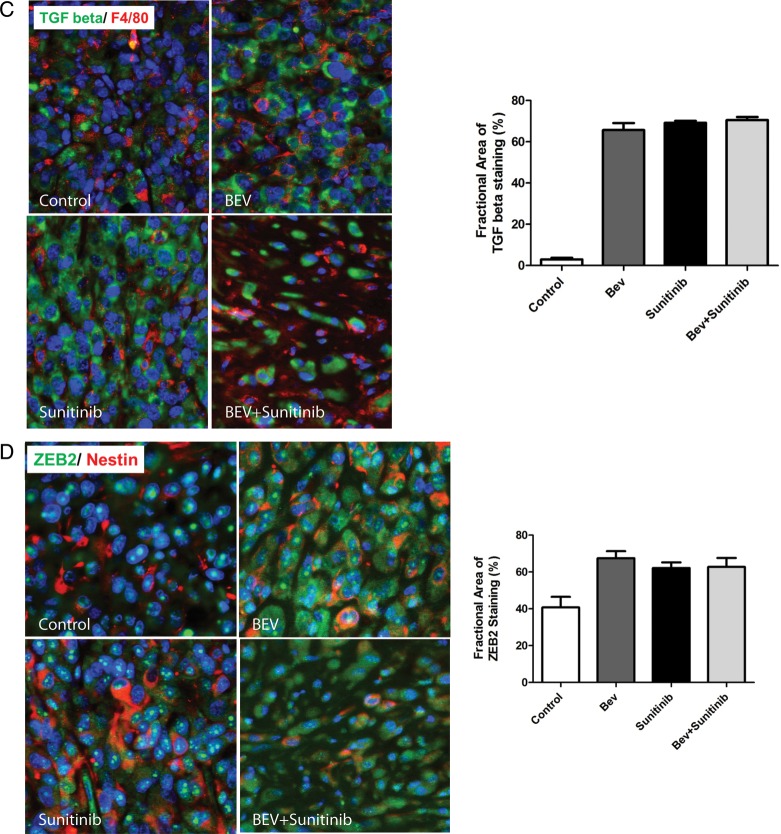
Vascular endothelial growth factor (VEGF) is a critical regulator of angiogenesis. Inhibiting the VEGF-VEGF receptor (R) signal transduction pathway in glioblastoma has recently been shown to delay progression, but the relative benefit and mechanisms of response and failure of anti-VEGF therapy and VEGFR inhibitors are not well understood. The purpose of our study was to evaluate the relative effectiveness of VEGF sequestration and/or VEGFR inhibition on orthotopic tumor growth and the mechanism(s) of treatment resistance. We evaluated, not only, the effects of anti-VEGF therapy (bevacizumab), anti-VEGFR therapy (sunitinib), and the combination on the survival of mice bearing orthotopic gliomas, but also the differential effects of the treatments on tumor vascularity, cellular proliferation, mesenchymal and stem cell markers, and myeloid cell infiltration using flow cytometry and immunohistochemistry. Bevacizumab significantly prolonged survival compared with the control or sunitinib alone. Both antiangiogenic agents initially reduced infiltration of macrophages and tumor vascularity. However, multitargeted VEGFR inhibition, but not VEGF sequestration, rapidly created a vascular gradient and more rapidly induced tumor hypoxia. Re-infiltration of macrophages was associated with the induction of hypoxia. Combination treatment with bevacizumab and sunitinib improved animal survival compared with bevacizumab therapy alone. However, at the time of tumor progression, a significant increase in CD11b(+)/Gr1(+) granulocyte infiltration was observed, and tumors developed aggressive mesenchymal features and increased stem cell marker expression. Collectively, our results demonstrate a more prolonged decrease in tumor vascularity with bevacizumab than with sunitinib, associated with a delay in the development of hypoxia and sustained reduction of infiltrated myeloid cells.
Figures
Comment in
-
Angiogenesis inhibition: quo vadis?Neuro Oncol. 2012 Nov;14(11):1315. doi: 10.1093/neuonc/nos274. Neuro Oncol. 2012. PMID: 23095501 Free PMC article. No abstract available.
Similar articles
-
Acquired resistance to anti-VEGF therapy in glioblastoma is associated with a mesenchymal transition.Clin Cancer Res. 2013 Aug 15;19(16):4392-403. doi: 10.1158/1078-0432.CCR-12-1557. Epub 2013 Jun 26. Clin Cancer Res. 2013. PMID: 23804423
-
Inhibition of vascular endothelial growth factor reduces angiogenesis and modulates immune cell infiltration of orthotopic breast cancer xenografts.Mol Cancer Ther. 2009 Jul;8(7):1761-71. doi: 10.1158/1535-7163.MCT-09-0280. Epub 2009 Jun 30. Mol Cancer Ther. 2009. PMID: 19567820
-
Intrinsic bevacizumab resistance is associated with prolonged activation of autocrine VEGF signaling and hypoxia tolerance in colorectal cancer cells and can be overcome by nintedanib, a small molecule angiokinase inhibitor.Oncotarget. 2014 Jul 15;5(13):4709-21. doi: 10.18632/oncotarget.1671. Oncotarget. 2014. PMID: 25015210 Free PMC article.
-
Therapeutic implication of vascular endothelial growth factor receptor-1 (VEGFR-1) targeting in cancer cells and tumor microenvironment by competitive and non-competitive inhibitors.Pharmacol Res. 2018 Oct;136:97-107. doi: 10.1016/j.phrs.2018.08.023. Epub 2018 Aug 28. Pharmacol Res. 2018. PMID: 30170190 Review.
-
A review of VEGF/VEGFR-targeted therapeutics for recurrent glioblastoma.J Natl Compr Canc Netw. 2011 Apr;9(4):414-27. doi: 10.6004/jnccn.2011.0038. J Natl Compr Canc Netw. 2011. PMID: 21464146 Free PMC article. Review.
Cited by
-
CAR-T Therapy in GBM: Current Challenges and Avenues for Improvement.Cancers (Basel). 2023 Feb 16;15(4):1249. doi: 10.3390/cancers15041249. Cancers (Basel). 2023. PMID: 36831591 Free PMC article. Review.
-
Relationship between Macrophage and Radiosensitivity in Human Primary and Recurrent Glioblastoma: In Silico Analysis with Publicly Available Datasets.Biomedicines. 2022 Jan 27;10(2):292. doi: 10.3390/biomedicines10020292. Biomedicines. 2022. PMID: 35203505 Free PMC article.
-
Antiangiogenic therapies for glioblastoma.CNS Oncol. 2014;3(5):349-58. doi: 10.2217/cns.14.31. CNS Oncol. 2014. PMID: 25363007 Free PMC article. Review.
-
All-Trans Retinoic Acid Fosters the Multifarious U87MG Cell Line as a Model of Glioblastoma.Brain Sci. 2021 Jun 18;11(6):812. doi: 10.3390/brainsci11060812. Brain Sci. 2021. PMID: 34207434 Free PMC article.
-
Autophagy in stem and progenitor cells.Cell Mol Life Sci. 2016 Feb;73(3):475-96. doi: 10.1007/s00018-015-2071-3. Epub 2015 Oct 26. Cell Mol Life Sci. 2016. PMID: 26502349 Free PMC article. Review.
References
-
- Ferrara N. Vascular endothelial growth factor: basic science and clinical progress. Endocr Rev. 2004;25:581–611. - PubMed
-
- Takano S, Yoshii Y, Kondo S, et al. Concentration of vascular endothelial growth factor in the serum and tumor tissue of brain tumor patients. Cancer Res. 1996;56:2185–2190. - PubMed
-
- Loges S, Schmidt T, Carmeliet P. “Antimyeloangiogenic” therapy for cancer by inhibiting PlGF. Clin Cancer Res. 2009;15:3648–3653. - PubMed
-
- Kerber M, Reiss Y, Wickersheim A, et al. Flt-1 signaling in macrophages promotes glioma growth in vivo. Cancer Res. 2008;68:7342–7351. - PubMed
Publication types
MeSH terms
Substances
Grants and funding
LinkOut - more resources
Full Text Sources
Medical
Research Materials
