

Minimizing back exchange in the hydrogen exchange-mass spectrometry experiment
- PMID: 22965280
- PMCID: PMC3515739
- DOI: 10.1007/s13361-012-0476-x
Minimizing back exchange in the hydrogen exchange-mass spectrometry experiment
Abstract
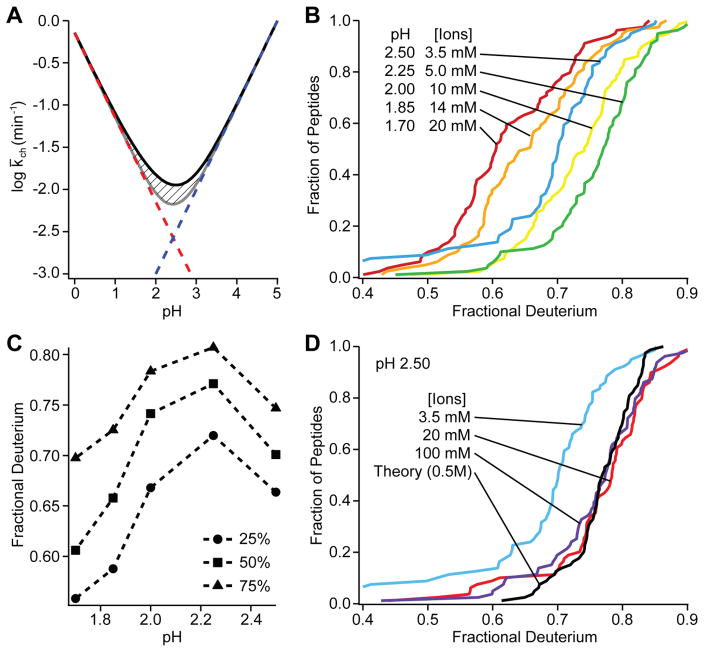
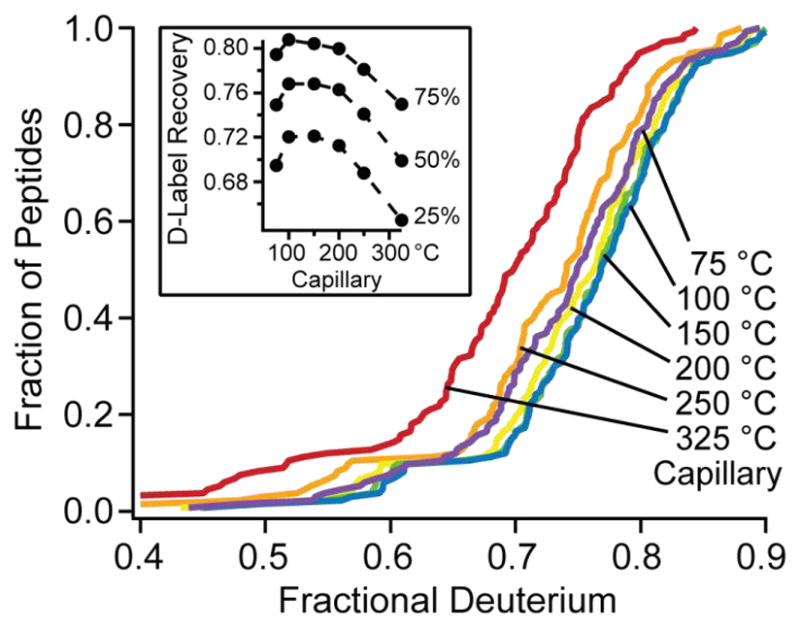
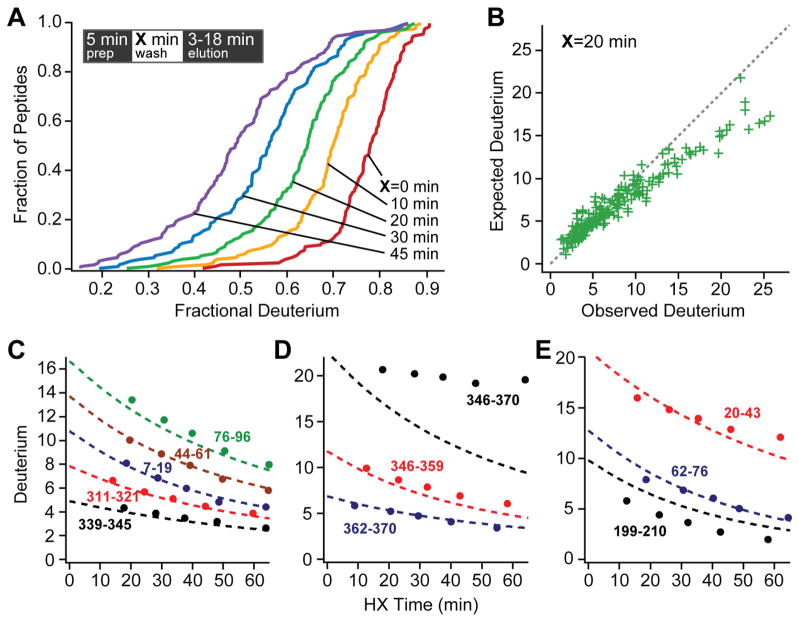
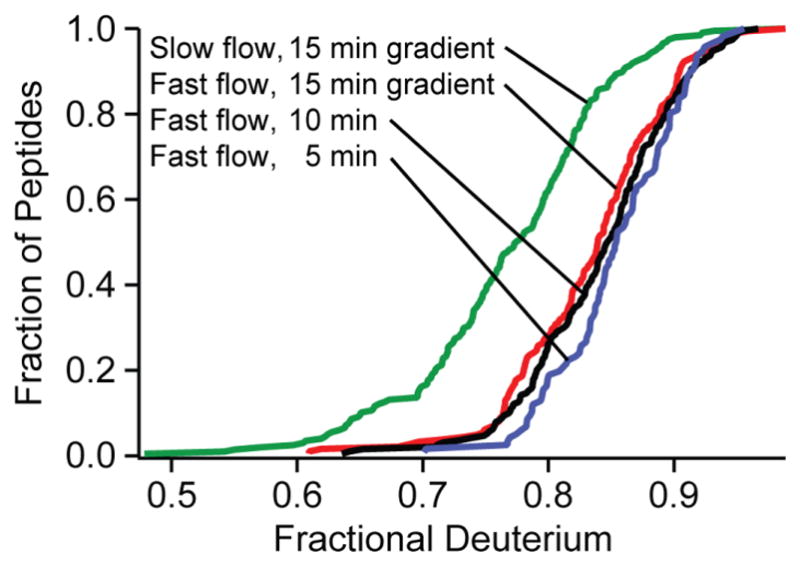
The addition of mass spectrometry (MS) analysis to the hydrogen exchange (HX) proteolytic fragmentation experiment extends powerful HX methodology to the study of large biologically important proteins. A persistent problem is the degradation of HX information due to back exchange of deuterium label during the fragmentation-separation process needed to prepare samples for MS measurement. This paper reports a systematic analysis of the factors that influence back exchange (solution pH, ionic strength, desolvation temperature, LC column interaction, flow rates, system volume). The many peptides exhibit a range of back exchange due to intrinsic amino acid HX rate differences. Accordingly, large back exchange leads to large variability in D-recovery from one residue to another as well as one peptide to another that cannot be corrected for by reference to any single peptide-level measurement. The usual effort to limit back exchange by limiting LC time provides little gain. Shortening the LC elution gradient by 3-fold only reduced back exchange by ~2%, while sacrificing S/N and peptide count. An unexpected dependence of back exchange on ionic strength as well as pH suggests a strategy in which solution conditions are changed during sample preparation. Higher salt should be used in the first stage of sample preparation (proteolysis and trapping) and lower salt (<20 mM) and pH in the second stage before electrospray injection. Adjustment of these and other factors together with recent advances in peptide fragment detection yields hundreds of peptide fragments with D-label recovery of 90% ± 5%.
Conflict of interest statement
Figures
Similar articles
-
Subzero temperature chromatography for reduced back-exchange and improved dynamic range in amide hydrogen/deuterium exchange mass spectrometry.Anal Chem. 2012 Nov 6;84(21):9601-8. doi: 10.1021/ac302488h. Epub 2012 Oct 19. Anal Chem. 2012. PMID: 23025328 Free PMC article.
-
Chromatography at -30 °C for Reduced Back-Exchange, Reduced Carryover, and Improved Dynamic Range for Hydrogen-Deuterium Exchange Mass Spectrometry.J Am Soc Mass Spectrom. 2022 Jul 6;33(7):1282-1292. doi: 10.1021/jasms.2c00096. Epub 2022 Jun 22. J Am Soc Mass Spectrom. 2022. PMID: 35732031 Free PMC article.
-
Peptide-column interactions and their influence on back exchange rates in hydrogen/deuterium exchange-MS.J Am Soc Mass Spectrom. 2013 Jul;24(7):1006-15. doi: 10.1007/s13361-013-0639-4. Epub 2013 May 7. J Am Soc Mass Spectrom. 2013. PMID: 23649779
-
Measuring the hydrogen/deuterium exchange of proteins at high spatial resolution by mass spectrometry: overcoming gas-phase hydrogen/deuterium scrambling.Acc Chem Res. 2014 Oct 21;47(10):3018-27. doi: 10.1021/ar500194w. Epub 2014 Aug 29. Acc Chem Res. 2014. PMID: 25171396 Review.
-
Analytical Aspects of Hydrogen Exchange Mass Spectrometry.Annu Rev Anal Chem (Palo Alto Calif). 2015;8:127-48. doi: 10.1146/annurev-anchem-062011-143113. Epub 2015 May 29. Annu Rev Anal Chem (Palo Alto Calif). 2015. PMID: 26048552 Free PMC article. Review.
Cited by
-
An Allosteric Anti-tryptase Antibody for the Treatment of Mast Cell-Mediated Severe Asthma.Cell. 2019 Oct 3;179(2):417-431.e19. doi: 10.1016/j.cell.2019.09.009. Cell. 2019. PMID: 31585081 Free PMC article.
-
Centromeres are maintained by fastening CENP-A to DNA and directing an arginine anchor-dependent nucleosome transition.Nat Commun. 2017 Jun 9;8:15775. doi: 10.1038/ncomms15775. Nat Commun. 2017. PMID: 28598437 Free PMC article.
-
Hydrogen-Deuterium Exchange within Adenosine Deaminase, a TIM Barrel Hydrolase, Identifies Networks for Thermal Activation of Catalysis.J Am Chem Soc. 2020 Nov 25;142(47):19936-19949. doi: 10.1021/jacs.0c07866. Epub 2020 Nov 12. J Am Chem Soc. 2020. PMID: 33181018 Free PMC article.
-
Comparing Hydrogen Deuterium Exchange and Fast Photochemical Oxidation of Proteins: a Structural Characterisation of Wild-Type and ΔN6 β2-Microglobulin.J Am Soc Mass Spectrom. 2018 Dec;29(12):2413-2426. doi: 10.1007/s13361-018-2067-y. Epub 2018 Sep 28. J Am Soc Mass Spectrom. 2018. PMID: 30267362 Free PMC article.
-
Protein Structural Characterization Using Electron Transfer Dissociation and Hydrogen Exchange-Mass Spectrometry.Bio Protoc. 2025 Jun 20;15(12):e5350. doi: 10.21769/BioProtoc.5350. eCollection 2025 Jun 20. Bio Protoc. 2025. PMID: 40620802 Free PMC article.
References
-
- Konermann L, Pan J, Liu YH. Hydrogen exchange mass spectrometry for studying protein structure and dynamics. Chem Soc Rev. 2011;40:1224–1234. - PubMed
-
- Tsutsui Y, Wintrode PL. Hydrogen/deuterium, exchange-mass spectrometry: A powerful tool for probing protein structure, dynamics and interactions. Curr Med Chem. 2007;14:2344–2358. - PubMed
Publication types
MeSH terms
Substances
Grants and funding
LinkOut - more resources
Full Text Sources
Other Literature Sources
